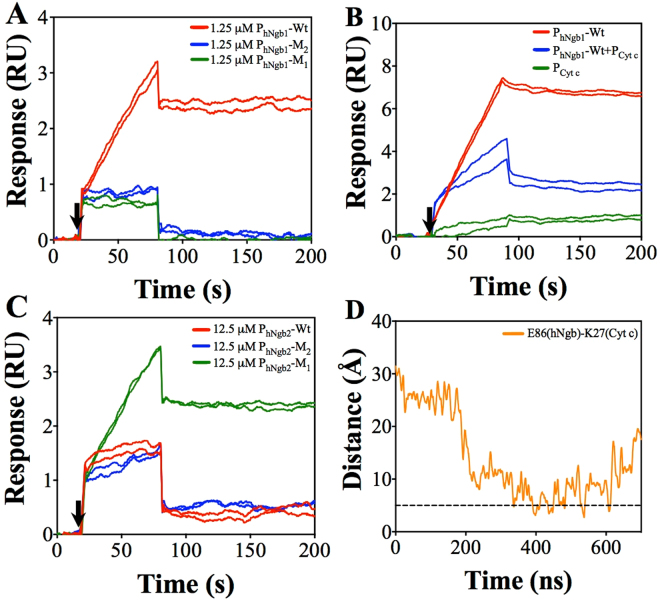
Figure 4.
(A) SPR sensorgrams for qualitative comparison of bindings for PhNgb1-Wt, PhNgb1-M1, and PhNgb1-M2. (B) SPR sensorgrams for inhibition of PhNgb1-Wt binding by PCyt c. (C) SPR sensorgrams for qualitative comparison of bindings for PhNgb2-Wt, PhNgb2-M1, and PhNgb2-M2. Black arrows in Fig. A to Fig. C show starting time of analyte injections. All peptides were injected for 60 s. (D) Distance between E86 (hNgb) and K27 (Cyt c) residues. The dotted line is drawn to show a reference line at 5 Å for salt bridge.

