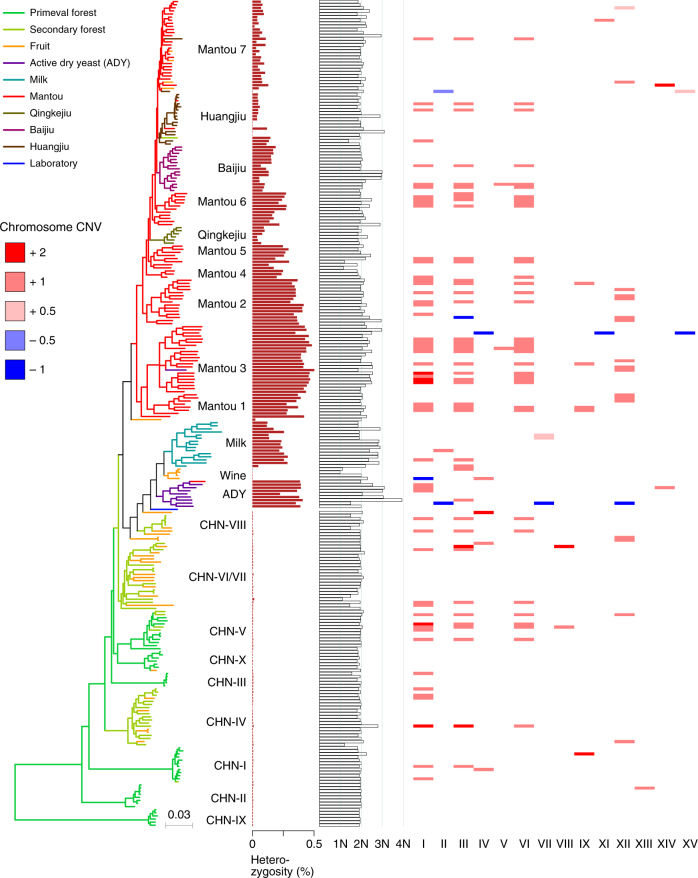
Fig. 2.
Heterozygosity, ploidy, and chromosome copy-number variation (CNV) in wild and domesticated isolates of S. cerevisiae. Isolates are represented by terminal branches in the phylogenetic tree constructed from the maximum likelihood analysis on genome wide SNPs and are colored according to their ecological origins. Heterozygosity is expressed as the ratio of heterozygous SNPs to the consensus genome size of each isolate. Ploidy of each isolate was estimated using flow cytometry and is represented by a bar graph. Amplification of individual chromosomes above 2n is shown by a pink or red stripe with a digital value (pink 0.5, amplification of a part of the chromosome; light red 1, one extra copy of the whole chromosome; dark red 2, two extra copies of the whole chromosome). Deletion of individual chromosome below 2n is shown by a blue stripe with a digital value (light blue −0.5, deletion of a part of the chromosome; dark blue −1, deletion of one copy of the whole chromosome)

