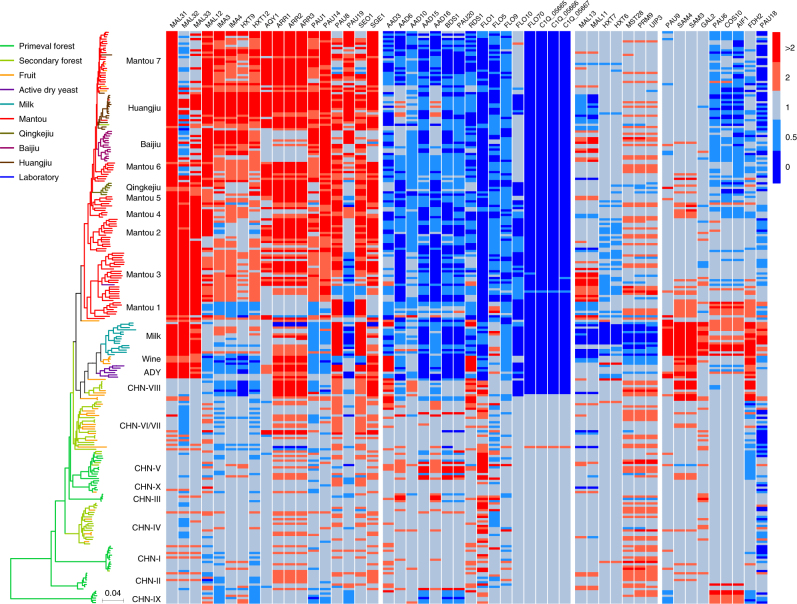
Fig. 3.
Copy-number variation (CNV) of selected genes in wild and domesticated isolates of S. cerevisiae. Gene names are given at the top of the heat map. Isolates are represented by terminal branches in the phylogenetic tree constructed from the maximum likelihood analysis on genome wide SNPs and are colored according to their ecological origins. Heat map colors reflect different degrees of gene duplication (red shades) or deletion (blue shades) from the basal level (grey) according to the scale on the right with strain S288c as the reference. The exact relative values of CNV are given in Supplementary Data 6

