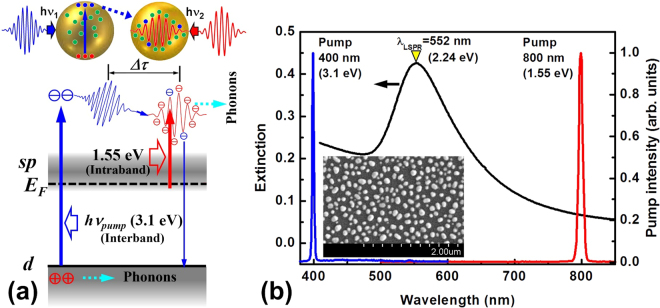
Figure 1.
(a) The schematic illustration of the interband (at 3.1 eV) and intraband (at 1.55 eV) excitation and the relaxation of the excited conduction-band electrons into plasmonic oscillation. Δτ measures the time delay for the interband excitation produced electrons to “join” the plasmonic oscillation process. Dashed arrows in light blue illustrate energy transfer from electrons/holes to lattices through phonon population, as relaxation pathways. (b) Optical extinction spectrum (black) measured on the AuNPs shown in the inset by the SEM image and the pump spectrum centered at 400 (blue) and 800 nm (red) in the transient absorption measurement.

