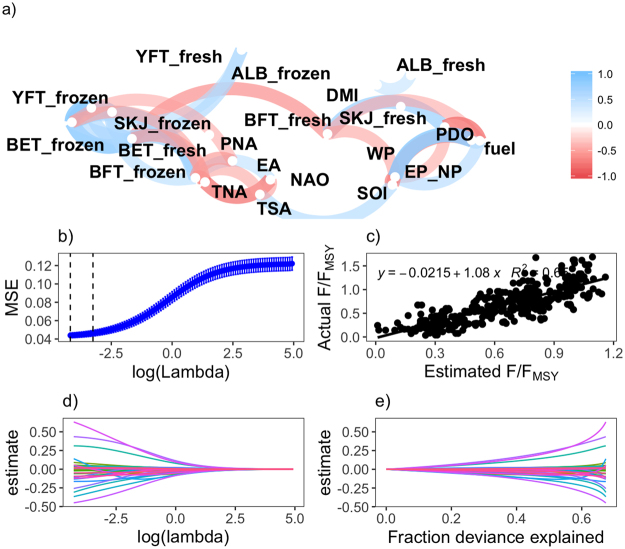
Figure 2.
Model skill and cross-validation from the ridge regression analysis. (a) Pearson’s Correlation between feature variables, the plot uses clustering and the closer the variables are to each other the higher the relationship. While the opposite is true for widely spaced variables. The colour and thickness of the line represents the direction of the relationship and the strength. (b) Scatterplot to fit actual and estimated F/FMSY for global tunas. (c) Mean – Squared Error (MSE) versus log ( to show the cross-validation (CV) curve (blue line) with upper and lower standard deviations along the sequence. The left most vertical line occurs at the CV minimum and the right vertical line is the largest value of lambda such that the error falls within one standard error of the minimum. (d) Estimates of the coefficients versus . (e) Estimates of the coefficients versus deviance explained (Overall deviance explained 68%).

