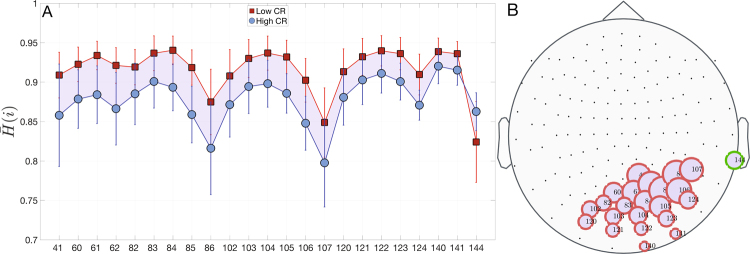
Figure 5.
Differences of entropy (i) between low and high CR groups. In (A) we show the mean and standard deviations of the entropy of nodes that have statistical significant differences between groups. (red squares) is higher than (blue circles) for nearly all nodes. In (B) we plot the position of nodes with statistical differences. Node sizes are proportional to . Red borders represent , otherwise node borders are green. In this case, we used a permutation test but no relevant changes appear when a rank-sum test is carried out (see Supp. Info.).

