Figure 1.
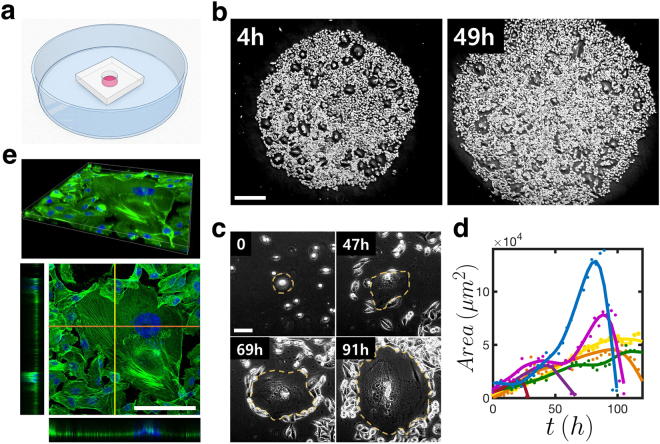
Spontaneous emergence of cellular senescence in populations of MDA-MB-231 breast cancer cells. (a) Schematic diagram illustrating a small polydimethylsiloxane (PDMS) well in a culture dish. Detached cells (red) are put into the well; the PDMS is removed after 4 5 hours of planting. (b) Phase-contrast snapshot images taken at two different times after the initial seeding; ‘holes’ are the areas occupied by senescent cells. (c) Close-up views of an exemplary cellular senescence (outlined by dashed lines) developing in time. (d) The growing (followed by apoptosis) areal sizes of several different senescent cells. (e) An exemplary confocal 3D immuno-stained image of a senescent cell showing the distribution of filamentous actin marker phalloidin (green) and nuclei marker Hoechst staining (blue). Each side view shows a slice cut in z-direction at the highlighted locations (stretched three times for a better visualization). The 3D image consists of a confocal z-stack of 49 images. [scale bars: (b) 500 μm; (c) and (e) 100 μm]

