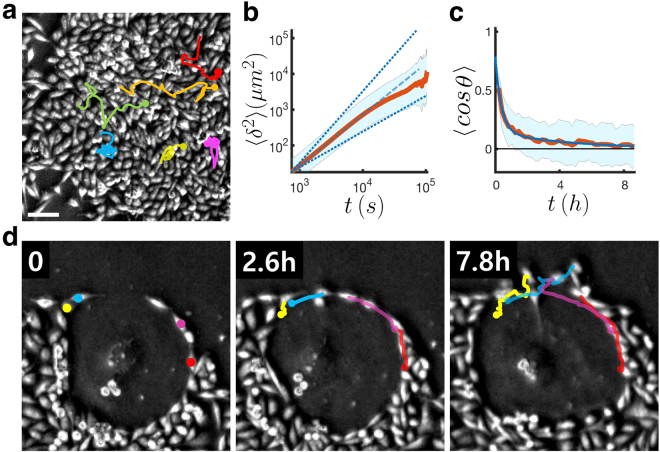
Figure 2.
Motile behaviors of MDA-MB-231 cells within the cell colony. (a) Cells percolating within a confluent population and (d) Cells exhibiting haptotactic movements along the boundary of a senescent cell body (see Supplementary Video S1). (b) is the log-log plot of the average of mean-squared displacements vs. time interval (n = 42) illustrating the super-diffusiveness of the cells in (a). (c) 〈cos θ〉 vs. t (red line) for the same n = 42 cells and its fit to the function (blue line) with τ0 = 0.38 hr, τ = 4.56 hour, A = 0.14, and B = 0.64. The shades in (b,c) represent the standard deviation at each t. The scale bar of 100 μm applies to all phase-contrast images in this figure.

