
Figure 5.
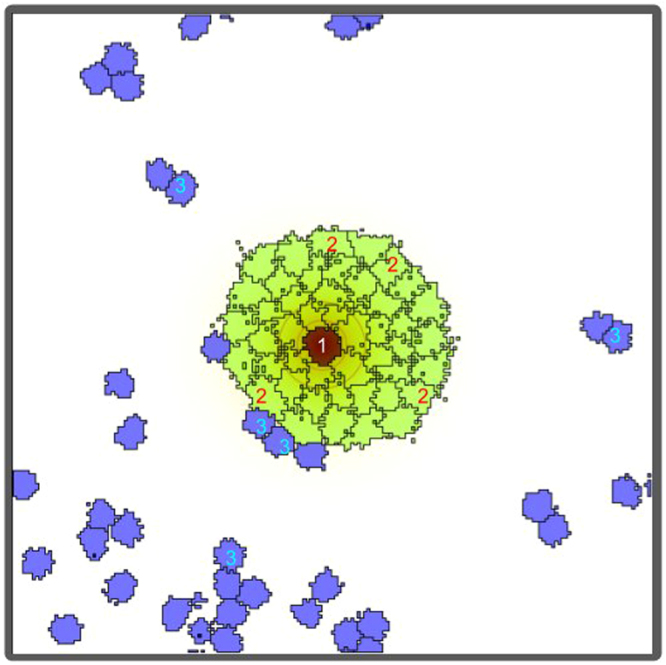
Schematic illustration of different domains introduced in our Potts Model. All together there are four different 3D domains: one core region of a senescent cell (indexed by σ = 1, target volume = 1800 μm3, target surface asperity = 0.8); a tightly connected aggregate of 48 small domains (σ = 2, target volumes = 600 μm3, target surface asperity = 0.8) maintaining a very thin, yet, dynamic cytoskeletal structure around the core; 20 small domains (σ = 3, target volume = 400 μm3, target surface asperity = 1.4) representing non-senescent tumor cells; and, one simply-connected domain (σ = 0) representing the culture medium the cell domains are immersed in. The shown 2D image is a 2D slice (n = 2) of 3D z-stack images. Only a few domains are labeled for clarity.