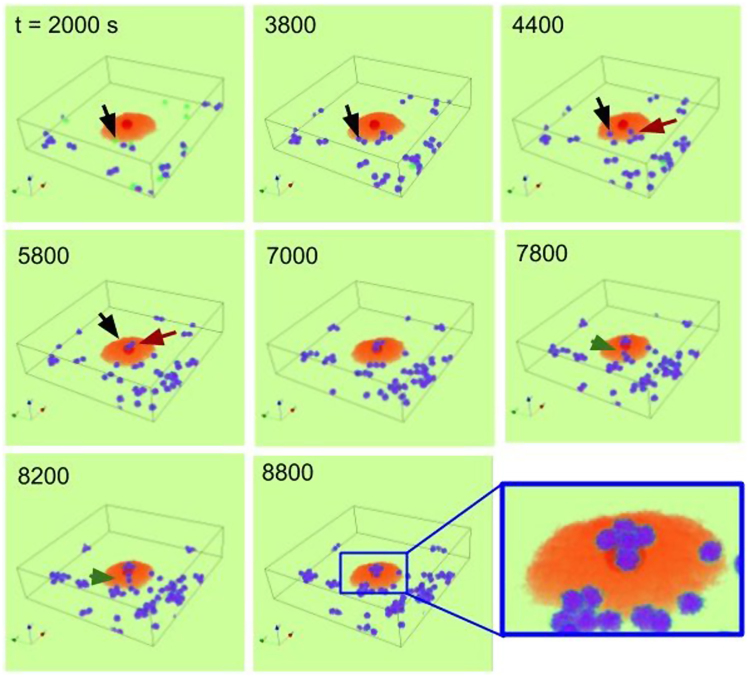
Figure 6.
3D simulation of a cell cluster formation at the core of a senescent cell. 1s is equivalent as one Monte Carlo step. The black and brown arrows mark the positions of two single (separated) daughter cells from t = 2000 s up to t = 5800 s. Similarly, the green arrow-heads mark the position of one ‘dumbbell’ (a pair of daughter cells) from t = 7800 s up to t = 8200 s. The marked daughter cells migrate towards the core to form a 3D cluster (see Supplementary Video S3). The grid size is 200 × 200 × 50 μm2, and periodic boundary conditions are applied at all boundaries except for the top and the bottom. Non-senescent cells replicate with a period τr = 5000 ± 1000 s (mean ± sd). The following color code scheme is used: senescent cell (core: dark red, body: light red); first generation tumor cells (green), replicated tumor cells (blue). p = 2 μm−3s−1, d = 0.02 s−1 and D = 2 μm2s−1. The rest of parameter values are given in Methods.

