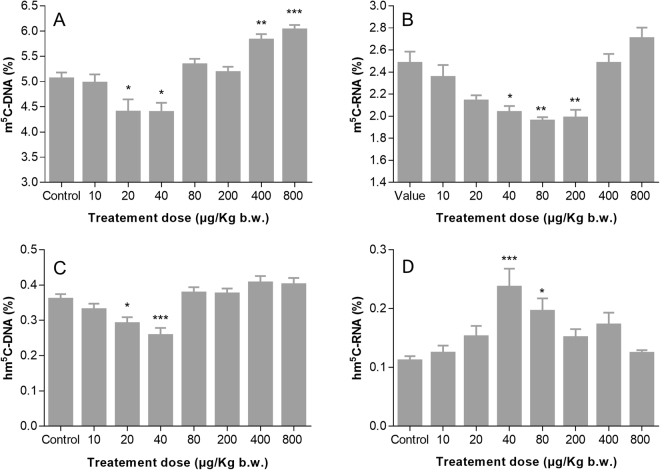
Figure 3.
Global DNA/RNA (hydroxy)methylation modulation in rat liver upon exposure to PAH mixture. DNA methylation (m5C-DNA) (A) and hydroxymethylation (hm5C-DNA) (C) levels, RNA methylation (m5C-RNA) (B) and hydroxymethylation (hm5C-RNA) (D) levels variation over different doses (n = 8, excepting for dose 40 µg/kg b.w. were n = 7) are depicted. The means together with the standard error of the mean are shown as grey columns and bars, respectively. Based on the ANOVA statistical analysis, p- values (*<0.05; ** < 0.01; ***<0.001) have been calculated using a Bonferroni’s multiple comparisons test, as detailed in the section 2.3, in order to assess the statistical significance of the observed mean values as compared to the control group.

