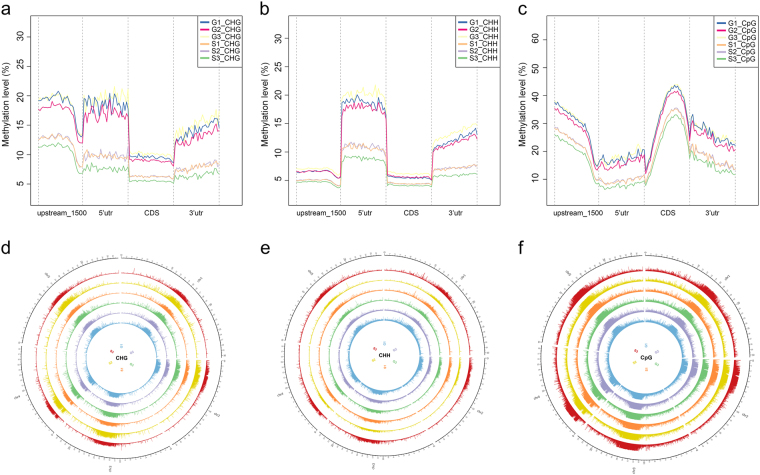
Fig. 2.
DNA methylation patterns in various genomic regions. a–c Distribution of the DNA methylation levels in the CHG a, CHH b, and CpG c contexts among various gene regions, including the promoter, 5’UTR, gene body and 3’UTR in ground controls (G1–G3), and in plants maintained under microgravity conditions (S1–S3). d–f Circos plots showing Arabidopsis genomic methylation in ground controls (G1–G3) and in plants maintained under microgravity conditions (S1–S3). The outer track represents five chromosomes of the Arabidopsis genome. The other histogram tracks represent differentially methylated regions in the CHG d, CHH e, and CpG f contexts

