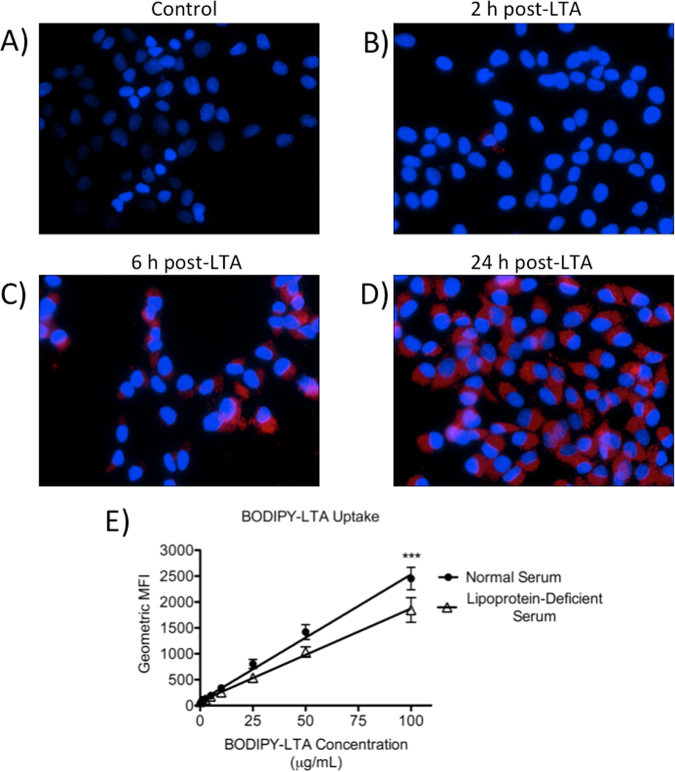
Figure 2.
Time-course and dose-response of LTA uptake by HepG2 cells over 24 h. Uptake of fluorescent LTA by cells cultured in 20% normal human serum was visualized through fluorescence microscopy in untreated cells (A) or in cells treated with 10 μg/mL of BODIPY 630/650-LTA for 2 h (B), 6 h (C), or 24 h (D), or measured via flow cytometry for cells cultured in either 20% normal serum or lipoprotein-deficient serum (prepared in laboratory) and treated with increasing concentrations of fluorescent LTA over 24 h (E). Nuclei are stained in blue with DAPI, and BODIPY 630/650-LTA appears red (200× magnification). Data are representative of 3 experiments (A–D), and are expressed as mean ± SEM from 3 experiments (E). ***p < 0.001 by two-way ANOVA. MFI, mean fluorescence intensity.

