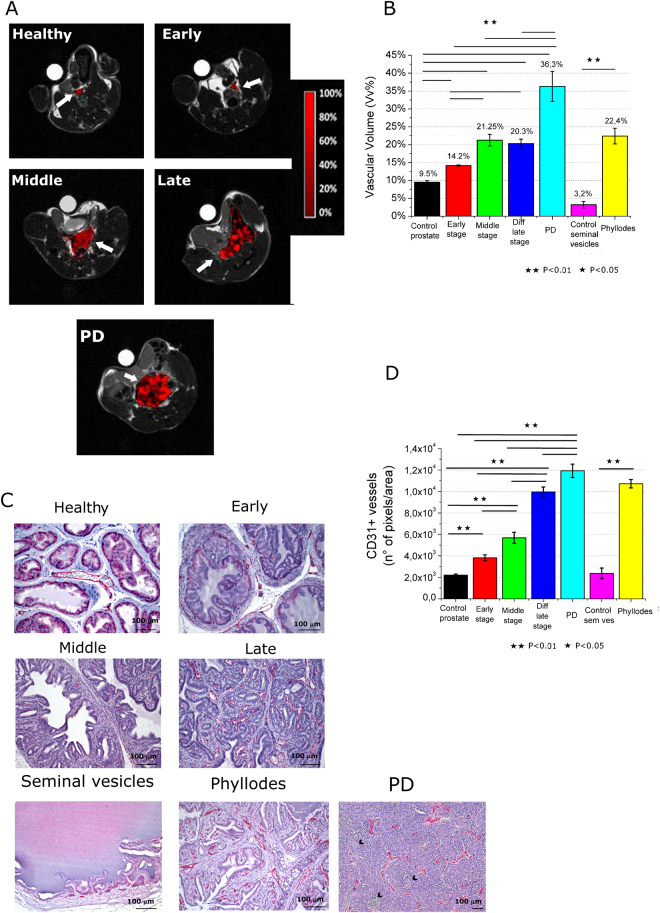
Figure 2.
(A) Representative Vascular volume maps of representative healthy C57BL/6 mouse and TRAMP mice at early, middle and late development stages (including PD tumor); (B) Mean Vascular volume in the prostate region for the different groups and control health mice. Data are reported as mean ± SE; (C) CD-31 immunohistochemistry (in red) of representative healthy C57BL/6 mouse and TRAMP mice prostate and of healthy seminal vesicles and phyllodes tumor (Magnification 200×, black arrows indicate necrosis); (D) Quantification of vessels by image analysis of red pixels (CD-31 staining). (n = 8).

