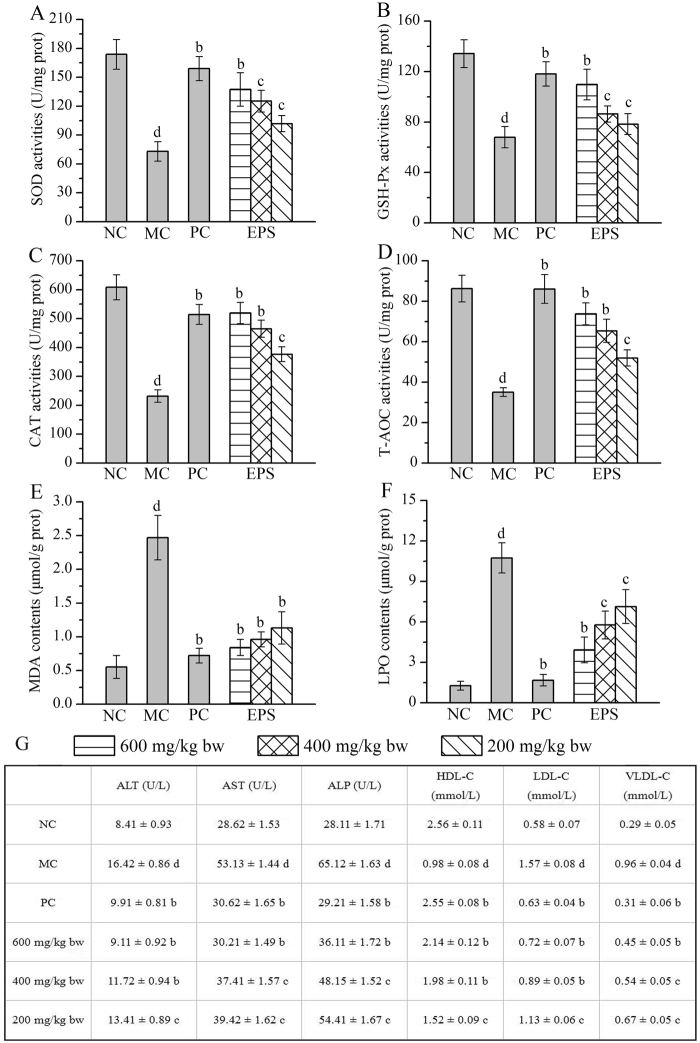
Figure 6.
Effects of EPS on antioxidative status and serum biochemistry. (A) SOD; (B) GSH-Px; (C) CAT; (D) T-AOC; (E) MDA; (F) LPO of hepatic antioxidative enzymes; and (G) Effects of EPS on serum activities. The values were reported as the Mean ± S.D. (n = 10 for each group). Means with the same letter are not significantly different (P < 0.05, one-way ANOVA followed by Duncan’s post-hoc test). (d) P < 0.01, statistically significant compared with NC group; (c) P < 0.01, statistically significant compared with MC group; (b) P < 0.05, statistically significant compared with MC group.

