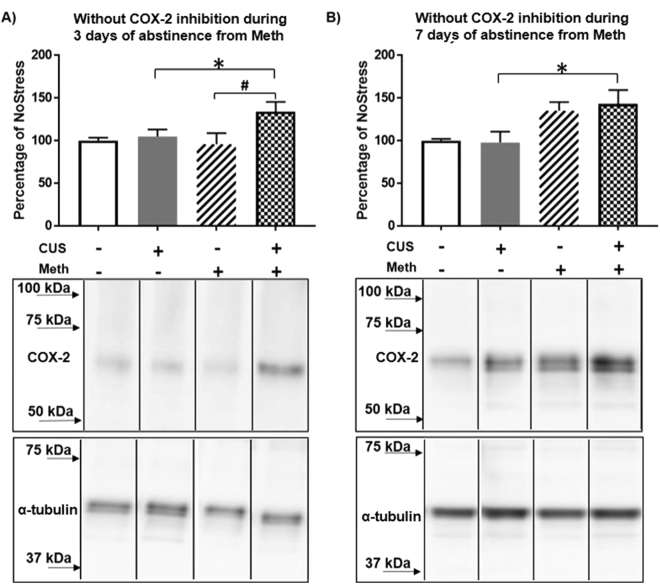
Figure 2.
COX-2 in cortical microvasculature during abstinence from Meth. (A) 3 days of abstinence from Meth increased COX-2 in CUS + Meth compared to CUS. (*p < 0.05) and Meth (#p < 0.01) n = 6–8/group. Middle panel shows representative blot probed for COX-2 after 3 days of abstinence from Meth and the bottom panel shows the loading control α-tubulin. (B) 7 days of abstinence from Meth increased COX-2 in CUS + Meth compared to CUS (*p < 0.05) n = 6–8/group. Middle panel shows representative blot probed for COX-2 after 7 days of abstinence from Meth and the bottom panel shows the blot for loading control α-tubulin. COX-2 and α-tubulin band images presented have been vertically sliced in order to juxtapose lanes that were non-adjacent in the blot. Full-length blots are presented in Supplementary Figures S2A and S2B.

