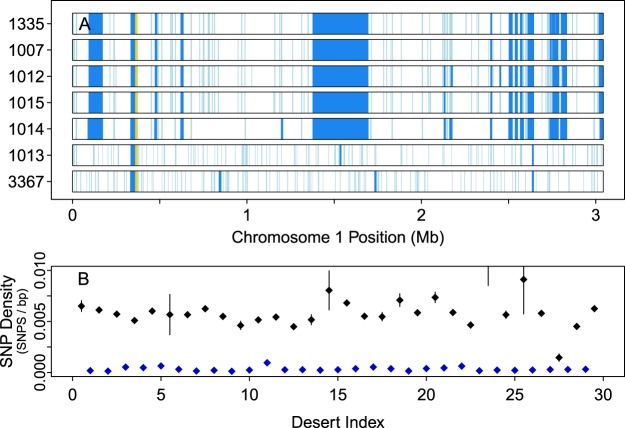
Figure 2.
Loss of heterozygosity in T. pseudonana isolates. (A) Distributions of significantly low SNP regions (“deserts”; light blue: length <10 Kb; dark blue: >10 Kb) determined using a negative binomial model (Methods) across the 3 Mb of Chromosome 1 for the seven T. pseudonana isolates. The gold region near 0.3 Mb is a gap of known size in the reference sequence. The large region centered near 1.5 Mb is a 320 Kb desert present in all L-isolates but neither H-isolate. (B) SNP densities in the 29 deserts that span at least 50 Kb of the CCMP 1335 genome (blue) and the thirty regions surrounding these deserts (including deserts shorter than 50 Kb; black). “Density” (p) in a region of length L having n SNPs is calculated and plotted as p ± 2σ, where p = n/L, and .

