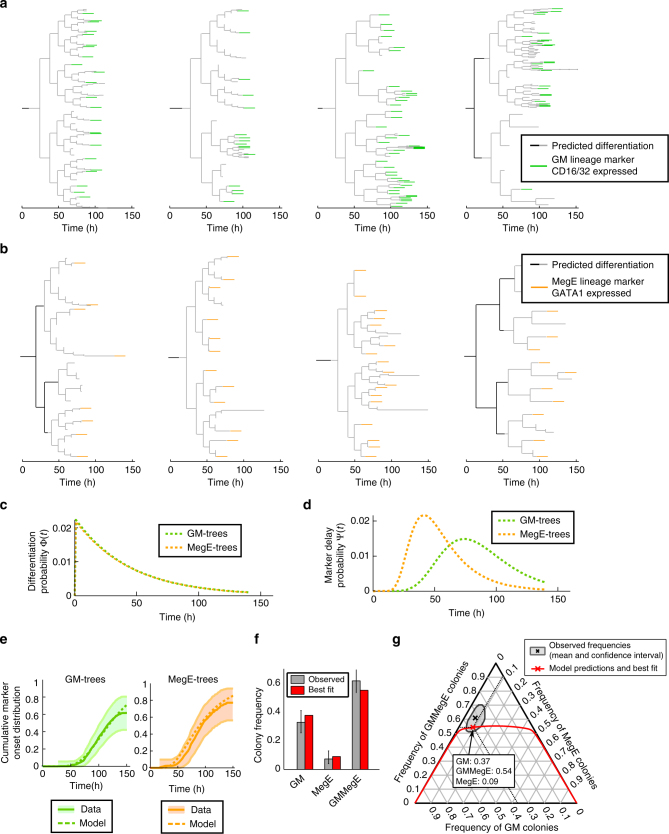
Fig. 3.
Prediction of early decisions in GM and MegE lineages with long dissimilar delay. a, b Four exemplary GM-fated (a) and MegE-fated (b) genealogies from the dataset used to infer time points of lineage choice. c The estimated differentiation distributions Φ (and hence the differentiation rate λ) are almost identical between GM- and MegE-fated genealogies. d The estimated delay distribution ψ show differences in the delay process between GM- and MegE-fated genealogies. e Combining the estimated Φ and ψ into the estimated cumulative marker onset distribution (dashed lines) fits the observed cumulative marker onset distributions (solid lines: mean, shaded area: 95% confidence intervals) in GM (green) and MegE (orange) genealogies. f A branching process model supplied with the estimated differentiation distributions Φ correctly predicts observed colony assay frequencies (n = 3 experiments, errorbars indicate 95% confidence intervals). g In the space of all possible frequencies of GM, MegE, and GMMegE colonies (adding up to 1), the observed colony assay data occupies is a single point (black) and an associated confidence interval (gray). Varying its only free parameter (pGM, see Methods), the branching process model traces a line (red) in frequency space and intersects the confidence region of the data. The frequencies of the best fit are marked with a red cross. While this model has one free parameter, its predictions with respect to GMMegE frequencies are almost independent of that parameter: the predicted frequency of GMMegE colonies is constrained to the [0.5, 0.55] interval unless either one of the non-GMMegE colony types is completely absent (left and right borders in Fig. 3G)

