Figure 1.
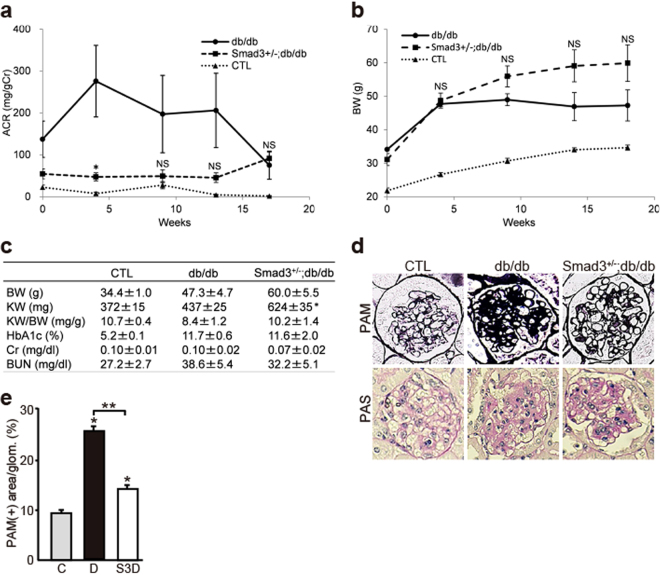
Effect of Smad3 deletion on phenotypic changes in diabetic nephropathy. (a) Time course of changes in urinary albumin excretion (as the ratio of albumin to creatinine) in the three groups – non-diabetic mice (normal control (CTL) mice) (▴), diabetic mice (db/db mice) (●) and Smad3-knockout diabetic mice (Smad3+/−; db/db mice) (▪) (n = 10 for normal control mice; n = 10 for db/db mice; n = 5 for Smad3+/−; db/db mice; NS, not significant, *p < 0.05 versus db/db mice, t test). (b) Time course of changes in body weight in the above three groups (NS, not significant, *p < 0.05 versus db/db mice, t test). (c) Biochemical data of the above groups (results are expressed as the mean ± S.E., *p < 0.05 versus db/db mice). (d) Representative photomicrographs of PAM staining from normal control mice (left panels), db/db mice (middle panels), and Smad3+/−; db/db mice (right panels). (e) Mesangial sclerotic fraction in the above three groups was determined as percentage of mesangial matrix area per total glomerular surface area. All glomeruli were analyzed for each sample (*p < 0.001 versus normal control mice, **p < 0.001 versus db/db mice, t test). C, D, and S3D stand for normal control mice, db/db mice, and Smad3+/−; db/db mice, respectively.

