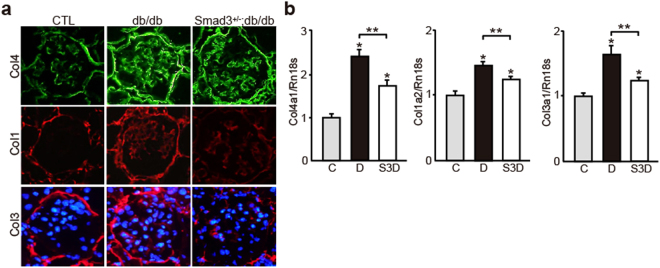
Figure 2.
Glomerular expression of ECM proteins in diabetic Smad3 knockout mice and control mice. (a) Representative photomicrographs of immunohistochemical staining of ECM proteins (Col4, Col1 and Col3) in the three groups (n = 10 for normal control mice; n = 10 for db/db mice; n = 5 for Smad3+/−; db/db mice; *p < 0.05 versus normal control mice, **p < 0.05 versus db/db mice, t test). Nuclei were stained with DAPI (blue). (b) The expression level of Col4 (Col4a1), Col1 (Col1a2), and Col3 (Col3a1) mRNA in the glomeruli in the above three groups. They were analyzed by qPCR and normalized to the expression of Rn18s. The values are expressed as the mean ± S.E. (*p < 0.05 versus normal control mice, **p < 0.05 versus db/db mice, t test). C, D, and S3D stand for normal control mice, db/db mice, and Smad3+/−; db/db mice, respectively.

