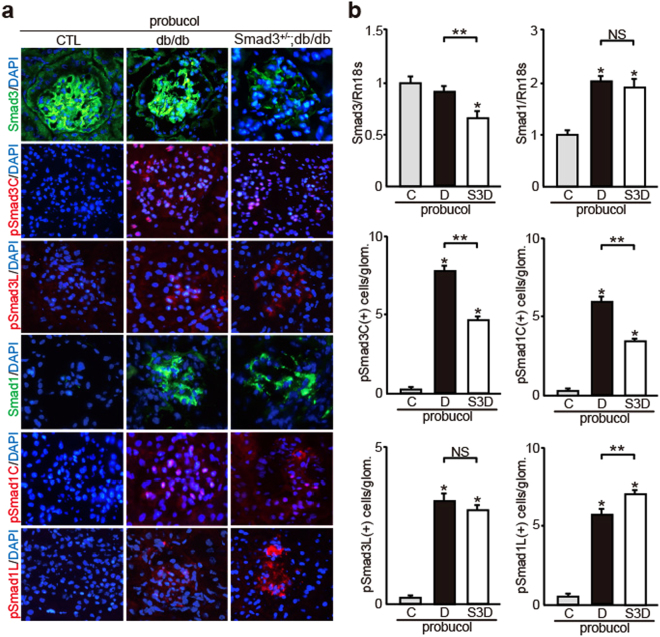
Figure 8.
Effects of probucol on the changes of both Smad1 and Smad3 and their phosphorylation forms in diabetic mice. (a) Immunohistochemical staining of Smad1, pSmad1C, pSmad1L, Smad3, pSmad3C and pSmad3L in glomeruli of three groups treated with probucol (normal control, db/db and Smad3+/−; db/db mice). Each lane represents representative data. (b) Quantitation of Smad1, pSmad1C, pSmad1L, Smad3, pSmad3C, and pSmad3L expression in the above three groups. Smad1 and Smad3 were assessed by quantitative PCR analysis, and normalized to the expression of Rn18s. As to pSmad1C, pSmad1L, pSmad3C, and pSmad3L, the number of each phosphorylated Smad1 or Smad3 protein positive nuclei was counted, and the mean values (per one glomerulus) were calculated (results are expressed as the mean ± S.E., NS, not significant, *p < 0.05 versus probucol-treated normal control mice, **p < 0.05 versus probucol-treated db/db mice, t test). C, D, and S3D stand for normal control mice, db/db mice, and Smad3+/−; db/db mice, respectively.

