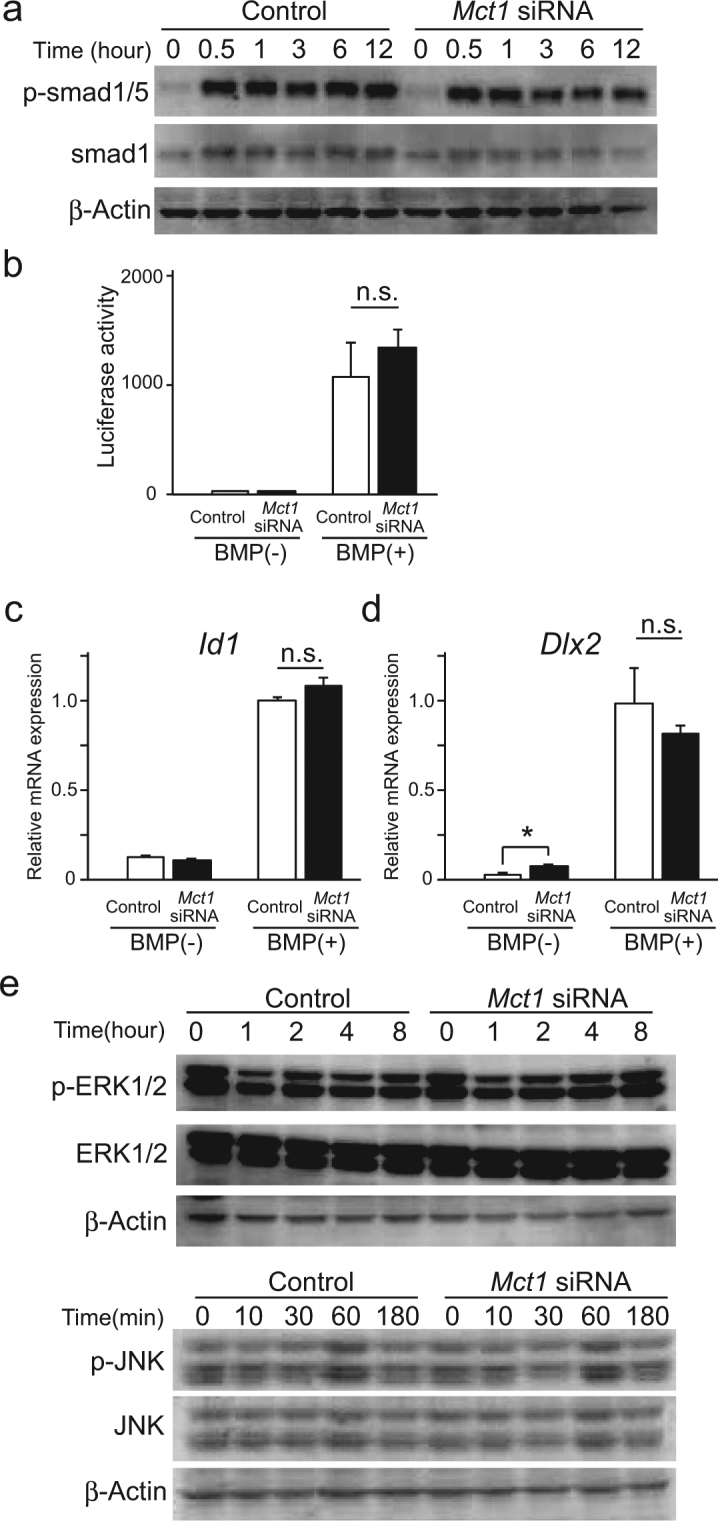
Figure 3.

Effects of Mct1 knockdown on Smad and MAP kinase pathways in C2C12 cells after stimulation by BMP-2. (a) Control and Mct1 siRNA-introduced C2C12 cells were exposed to BMP-2 (300 ng/mL) for the indicated periods. Phosphorylation of Smad1/5 and expression of Smad1 at various times after addition of BMP-2 were evaluated by western blotting. (b) C2C12 cells harboring control or Mct1 siRNA were transfected with an Id1.0-luciferase reporter plasmid and TK vector. After incubation for 24 hours with (+) or without (−) BMP-2 (300 ng/mL), light emission intensity was measured. Relative firefly luciferase reaction values were normalized against that of the luminescent reaction of Renilla luciferase from the TK vector. (c,d) C2C12 cells harboring control or Mct1 siRNA were incubated for 24 hours with (+) or without (−) BMP-2 (300 ng/mL). Expressions of Id1 mRNA (c) and Dlx2 mRNA (d) were quantitatively assessed by real-time RT-PCR, then normalized against that of Gapdh, with the results shown as relative values. (b,c) Data are expressed as the mean ± SD (n = 3–5). n.s., not significant. (e) Control and Mct1 siRNA-introduced C2C12 cells were exposed to BMP-2 (300 ng/mL) for the indicated periods, then expressions of ERK1/2 and JNK, as well as their phosphorylation were evaluated by western blotting. (a,e) Representative data from 3 independent experiments are shown. Quantitative evaluations of phosphorylation of Smad1/5, ERK1/2, and JNK are shown in Supplementary Figure S3. Full-length blots are presented in Supplementary Figure S9.
