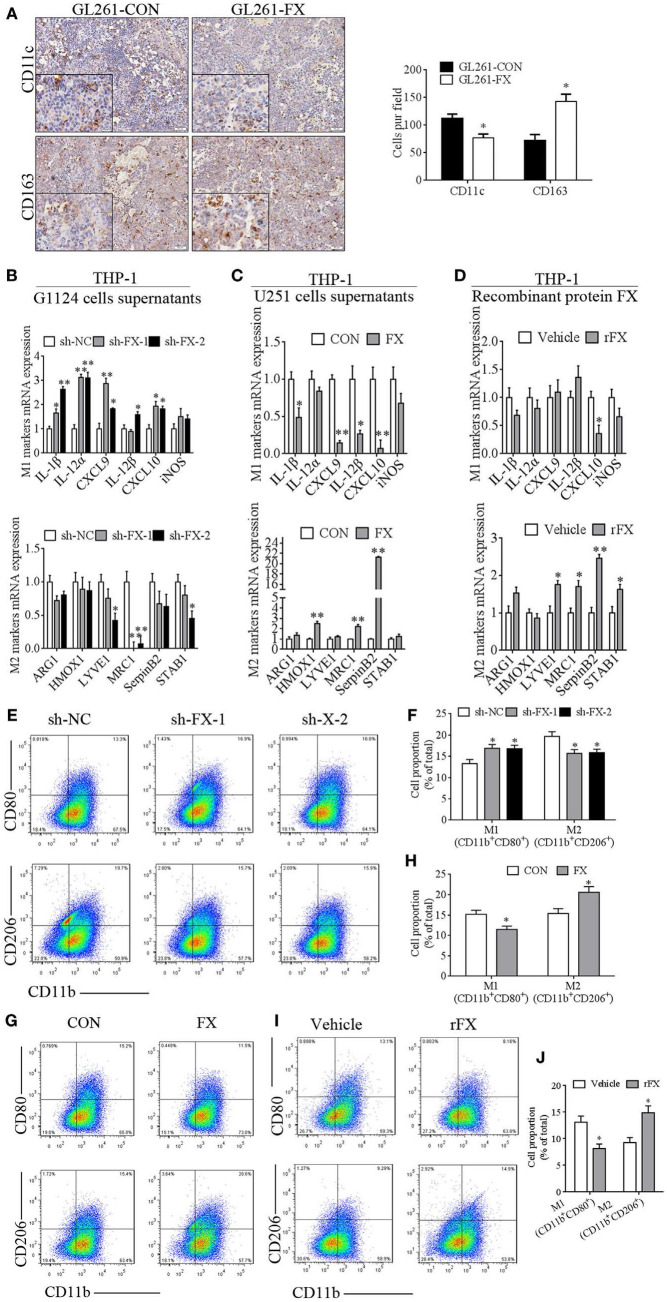
Figure 4.
Factor X (FX) promoted macrophage polarization to the M2 subtype. (A) Immunohistochemical staining of GL261-CON- and GL261-FX-derived xenografted tumors by CD11c and CD163 antibody. In GL261-FX-derived xenografted tumors, there was more CD163 staining and less CD11c staining than in the GL261-CON tumor. (B) Macrophage subtype markers were measured by real-time PCR after treatment with supernatants from G1124 cells transfected with sh-NC or sh-FX. In the sh-FX group, IL-1β, IL-12α, CXCL9, IL-12β, and CXCL10 levels were higher, while LYVE1, MRC1, and STAB1 levels were lower compared those in the sh-NC group (mean ± SEM, *p < 0.05, **p < 0.01). (C) Supernatants from U251 cells transfected with FX or control vectors were added to THP-1 cells, and the markers’ mRNAs were detected by real-time PCR. IL-1β, CXCL9, IL-12β, and CXCL10 levels were decreased, while HMOX1, MRC1, and SerpinB2 levels were increased when FX was overexpressed (mean ± SEM, *p < 0.05, **p < 0.01). (D) THP-1 cells were treated with recombinant protein FX and markers’ mRNAs were measured by real-time PCR. CXCL10 expression decreased, while M2 markers (LYVE1, MRC1, SerpinB2, and STAB1) increased after treatment with recombinant FX (rFX) (mean ± SEM, *p < 0.05, **p < 0.01). (E–J) CD80 and CD206 of phorbol 12-myristate 13-acetate (PMA)-primed THP-1 cells were detected by flow cytometry. (E) The proportion of M1 macrophages increased and M2 macrophages decreased when THP-1 cells were treated with G1124-sh-FX cell supernatants. (F) Bar graph of CD11b+CD80+ and CD11b+CD206+ cell proportion in panel (E). (G) The proportion of M1 macrophages decreased and M2 macrophages increased when THP-1 cells were treated with U251-FX cell supernatants compared with U251-CON. (H) Bar graph of CD11b+CD80+ and CD11b+CD206+ cell proportion in panel (G). (I) The proportion of M1 macrophages decreased and M2 macrophages increased when THP-1 cells were treated with FX recombinant protein. (J) Bar graph of CD11b+CD80+ and CD11b+CD206+ cell proportion in (I).

