Figure 1.
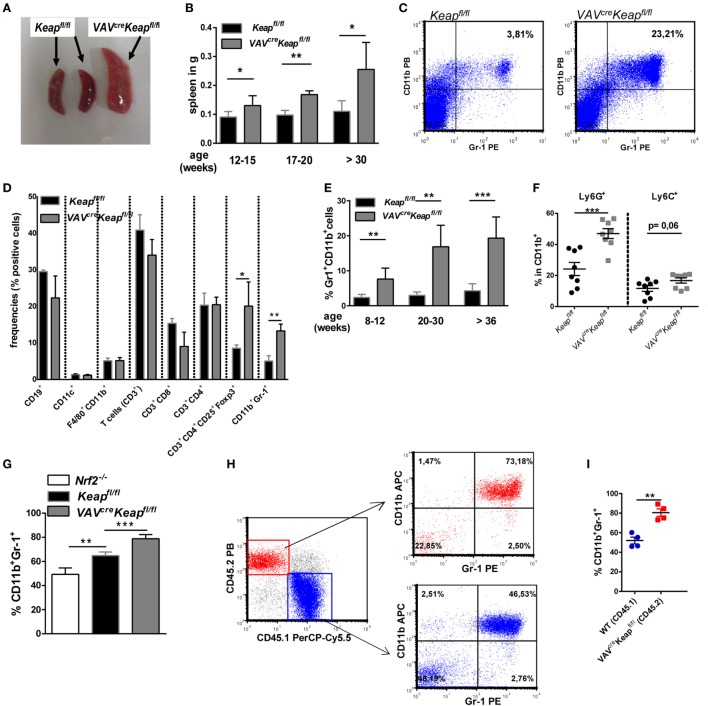
Nrf2 activation enhances CD11b+ Gr-1+ cells. (A) Spleens from old (50–52 weeks) Keapfl/fl and VAVcreKeapfl/fl mice. (B) Weight of spleens from Keapfl/fl and VAVcreKeapfl/fl mice at different ages. Bars indicate mean ± SD of at least three mice per group. (C) Representative dot plot depicting frequencies of CD11b+Gr-1+ cells in spleens from old (50–52 weeks) Keapfl/fl and VAVcreKeapfl/fl mice. (D) Frequencies of immune cell populations in spleens from 16-week-old Keapfl/fl and VAVcreKeapfl/fl mice. Bars indicate mean ± SEM of three mice per group. (E) Frequencies of CD11b+ Gr-1+ cells in spleens from Keapfl/fl and VAVcreKeapfl/fl mice at different ages. Bars indicate mean ± SD of at least six mice per group. (F) Frequencies of Ly6G+ and Ly6C+ cells within splenic CD11b+ cells from Keapfl/fl and VAVcreKeapfl/fl mice. (G) BM-derived cells were incubated with GM-CSF and IL-6 and frequencies of CD11b+Gr-1+ cells were assessed by flow cytometry. Bars indicate mean ± SD of at least three mice per group. (H) Mixed BM chimeric mice were analyzed 8 weeks after transfer of CD45.1 WT and CD45.2 VAVcreKeapfl/fl BM cells into lethally irradiated RAG2−/− recipient mice. WT mice were used, since Keapfl/fl CD45.1 mice were not available. Representative dot plots of splenic CD45.2+ Gr-1+CD11b+ and CD45.1+ Gr-1+CD11b+ cells are shown. (I) Percentages of splenic CD11b+Gr-1+ cells of CD45.1 and CD45.2 origin in bone marrow chimeras. For (F,I), each symbol indicates an individual mouse. Horizontal lines represent the mean; error bars represent SEM. Two-tailed unpaired t-tests were used to determine p-values for all statistical analysis.

