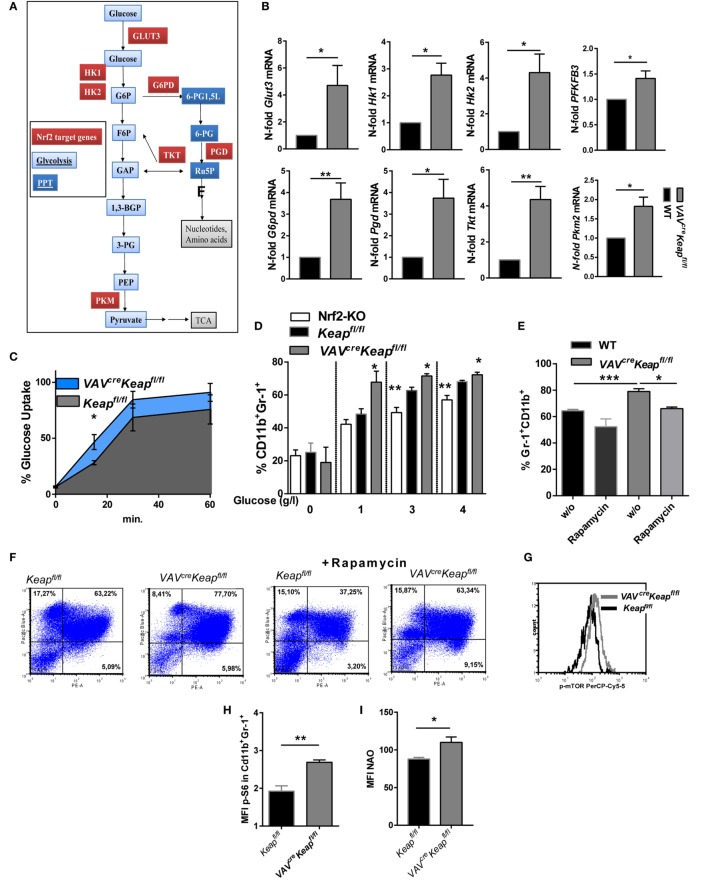
Figure 5.
Nrf2 induces metabolic activity in myeloid-derived suppressor cells (MDSCs). (A) Metabolic enzymes regulated by Nrf2 in glucose metabolism in MDSCs (own microarray and RT-qPCR data). (B) N-fold mRNA expression of metabolic enzymes in MACS isolated Keapfl/fl and VAVcreKeapfl/fl CD11b+Gr-1+ (n = 7–8, PFKFB3 n = 5) cells analyzed by RT-qPCR. Bars indicate mean and error bars SEM, two-tailed one sample test. (C) 2NBD-glucose incorporation was analyzed in CD11b+Gr1+ splenocytes from Keapfl/fl (n = 3) and VAVcreKeapfl/fl (n = 4) mice at different time-points, two-tailed unpaired t-test. (D) BM-derived cells were incubated with GM-CSF and IL-6 for 8 days with different glucose concentrations, and frequencies of CD11b+Gr-1+ cells were assessed by flow cytometry. Bars indicate mean ± SEM of three independent experiments per group, two-tailed unpaired t-test. (E,F) BM-derived cells were incubated with GM-CSF and IL-6 for 8 days in the absence or presence of 1 µM rapamycin, n = 4, two-tailed unpaired t-test. (G) Representative histogram of five experiments (p = 0.0155, two-tailed paired t-test) showing p-mTOR expression in splenic CD11b+Gr-1+ cells. (H) Mean fluorescent intensity of pS6 expression in CD11b+Gr-1+ cells. (I) Statistical analysis of mitochondrial mass of Keapfl/fl (n = 4) and VAVcreKeapfl/fl (n = 4) CD11b+Gr-1+ cells evaluated by assessing NAO mean fluorescence intensity, n = 3, two-tailed unpaired t-test. (J) OCR measured under basal conditions and after addition of the indicated drugs. Points indicate mean from six Keapfl/fl (n = 6) and six VAVcreKeapfl/fl (n = 6) CD11b+Gr-1+ cells, error bars SEM. (K) Statistical analysis of max. OCR. Bars indicate mean ± SEM. (L) ECAR measured under basal conditions and after addition of the indicated drugs. Points indicate mean from six Keapfl/fl (n = 6) and six VAVcreKeapfl/fl (n = 6) CD11b+Gr-1+ cells, error bars SEM, two-tailed unpaired t-test.


