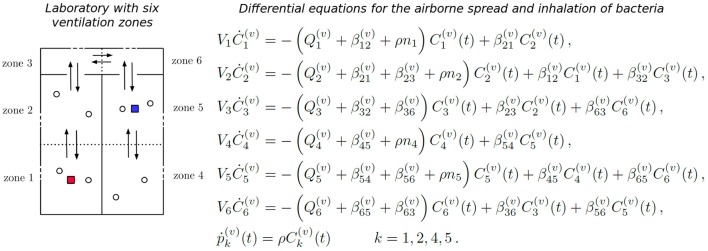
Figure 4.
Zonal ventilation model for the airborne spread of bacteria within a microbiology laboratory. (Left) A diagram showing the setup of two rooms and a corridor within a laboratory, split into six ventilation zones. Dotted lines represent the partitions of rooms, arrows between zones show potential airflow, which depends on the particular ventilation setting v considered, and dashed lines represent potential extract ventilation systems within each zone. Individuals are represented by circles, and the red and blue squares indicate two potential locations of the initial bacterial release. (Right) The system of ODEs that governs the airborne spread of bacteria across the ventilation zones, and the inhalation of these bacteria by individuals, for a particular ventilation setting v. Concentration of bacteria at zone j, Cj(t), increases with flow of air from neighboring zones (rates ) and decreases due to inhalation (rate ρ), flow of air to neighboring zones (rates ) and extraction (rate ). The cumulative amount of bacteria inhaled by each individual at zone j is denoted by .

