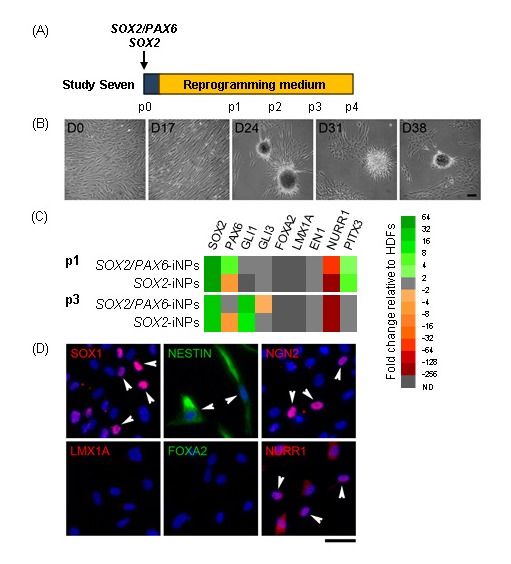
Figure 4:

Characterisation of SOX2-iNPs. (A) Schematic detailing experimental outline for Study Seven. Weekly passaging was commenced at day 17 post-transfection. (B) Phase contrast images of SOX2-iNPs over the course of reprogramming. Scale bar: 100 μm. (C) Heat map depicting gene expression in SOX2/PAX6- and SOX2-iNPs at p1 and p3 as fold changes relative to fibroblasts. (D) Expression of neural progenitor and regional markers in p4 SOX2-iNPs. Arrowheads indicate some cells with positive staining. Scale bar: 50 μm.
