Figure 8:

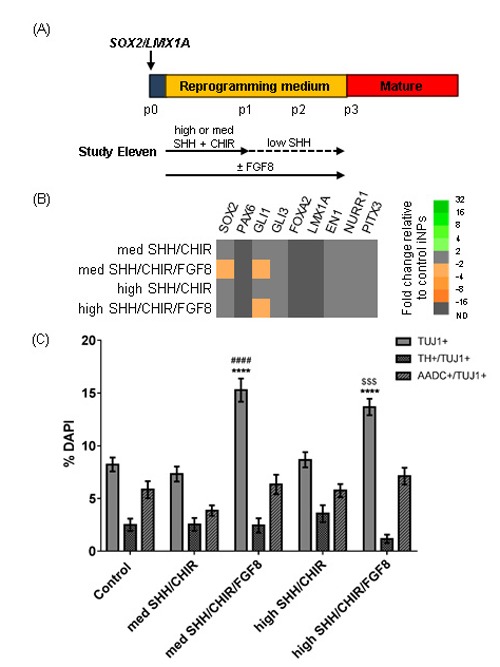
Investigating the effect of FGF8 and SHH concentration during SOX2/LMX1A-mediated reprogramming. (A) Schematic detailing experimental outline for Study Eleven. High SHH concentration was 500 ng/ml, med SHH was 200 ng/ml, low SHH was 20 ng/ml. (B) Heat map depicting gene expression in iNPs at p3 as fold changes relative to SOX2/LMX1A-iNPs reprogrammed standard reprogramming medium. (C) Quantification of TUJ1+, TUJ1+/TH+ and TUJ1+/AADC+ cells in differentiated iNP cultures. Data are presented as mean ± SEM, n = 16 – 33 fields of view from one cell line (number of cells counted per condition ≥ 3066). An ordinary one way ANOVA was performed for each stain, with Tukey’s multiple comparison test. Comparisons are as follows: to control iNPs (*), to med SHH/CHIR-patterned iNPs (#) or to high SHH/CHIR-patterned iNPs ($).
