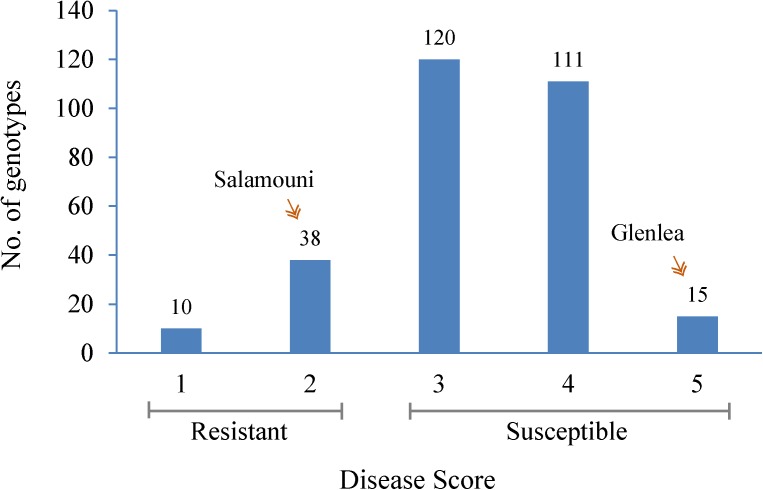
FIGURE 1.
Frequency distribution of the mean spot blotch infection response of 294 HWWAMP genotypes. The x-axis exhibits 1–5 scores of mean infection response of each genotype. The y-axis represents the number of genotypes (also numbered on the bar) that exhibited the infection response. Salamouni and Glenlea were the resistant and susceptible checks of the experiment, respectively.

