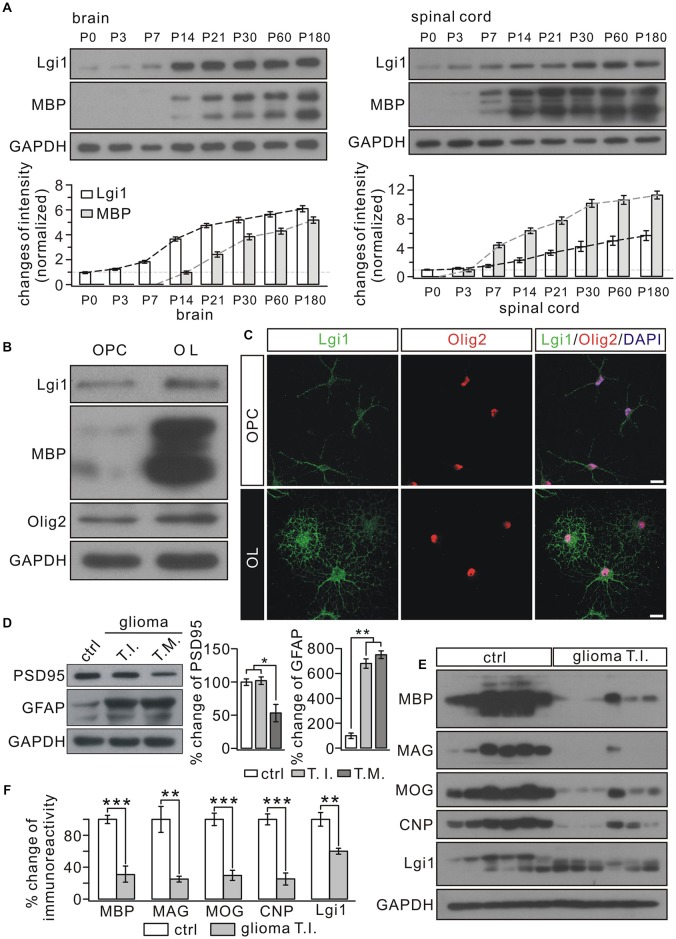
Figure 1.
Correlated expression between Leucine-rich glioma inactivated 1 (Lgi1) and MBP. (A) The expressions of Lgi1 and MBP in the brain and spinal cord (SC) from postnatal mice. (B) Lgi1 expression was significantly enhanced in of oligodendrocytes (OLs) compared with in oligodendrocyte precursorcells (OPCs). (C) The immunocytochemical staining of Lgi1 and Olig2 in OPCs and OLs. Scale bars, 20 μm. (D) An example showing the expression of PSD95 and GFAP in para-cancerous tissue (ctrl), tumor infiltration (TI), and tumor mass (TM) from one patient. The experiment was repeated for 18 times as the samples were from six patients. Histogram shows percentage changes of PSD95 and GFAP relative to GAPDH, the loading control. *p < 0.05, **p < 0.01. (E) Western blots of protein expression in isolated tumor infiltration and corresponding control tissues from six patients. Each band represents a sample from one patient. The experiment was repeated for three times. (F) Bar graphs show the percentage changes of MBP, myelin associated glycoprotein (MAG), myelin oligodendrocyte glycoprotein (MOG), cyclic nucleotide 3′-phosphodiesterase (CNP) and Lgi1 after normalized to ctrl. MBP, ***p < 0.001. MAG, **p = 0.0048. MOG, ***p < 0.001. CNP, ***p < 0.001. Lgi1, **p = 0.0096.

