FIGURE 6.
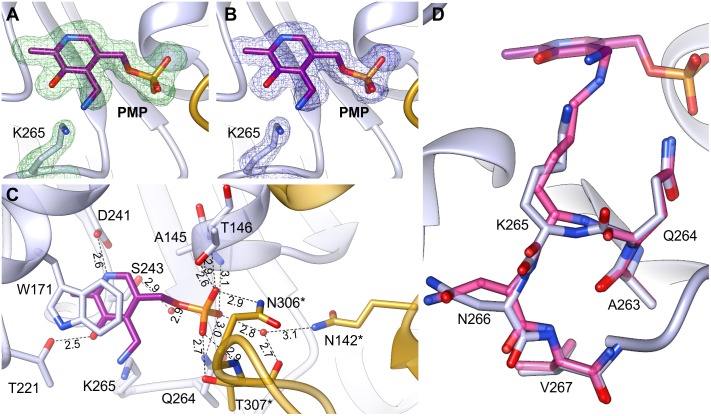
AtPSAT1-PMP complex. (A) OMIT Fo–Fc electron density map for K265 and PMP contoured at 3σ; (B) 2Fo–Fc map electron density map for K265 and PMP contoured at 1σ. (C) A detailed PMP binding mode; asterisks indicate residues from the other subunit. (D) Comparison of the conformation of AtPSAT1-PMP (light blue) with AtPSAT1-PLP internal aldimine (pink).

