
Figure 5.
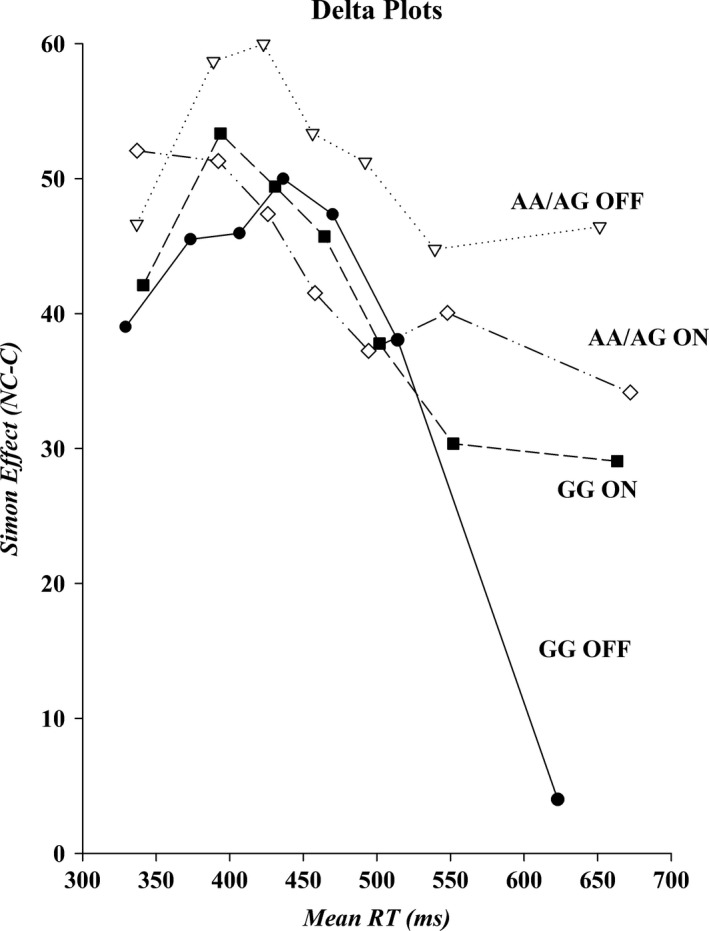
Delta plots for each genetic subtype on and off medication. The size of the Simon effect, shown on the y‐axis, is plotted against mean bin RT, shown on the x‐axis, for the fastest (Bin 1) to the slowest (Bin 7) bins. RT: reaction times
Official websites use .gov
A
.gov website belongs to an official
government organization in the United States.
Secure .gov websites use HTTPS
A lock (
) or https:// means you've safely
connected to the .gov website. Share sensitive
information only on official, secure websites.
Delta plots for each genetic subtype on and off medication. The size of the Simon effect, shown on the y‐axis, is plotted against mean bin RT, shown on the x‐axis, for the fastest (Bin 1) to the slowest (Bin 7) bins. RT: reaction times