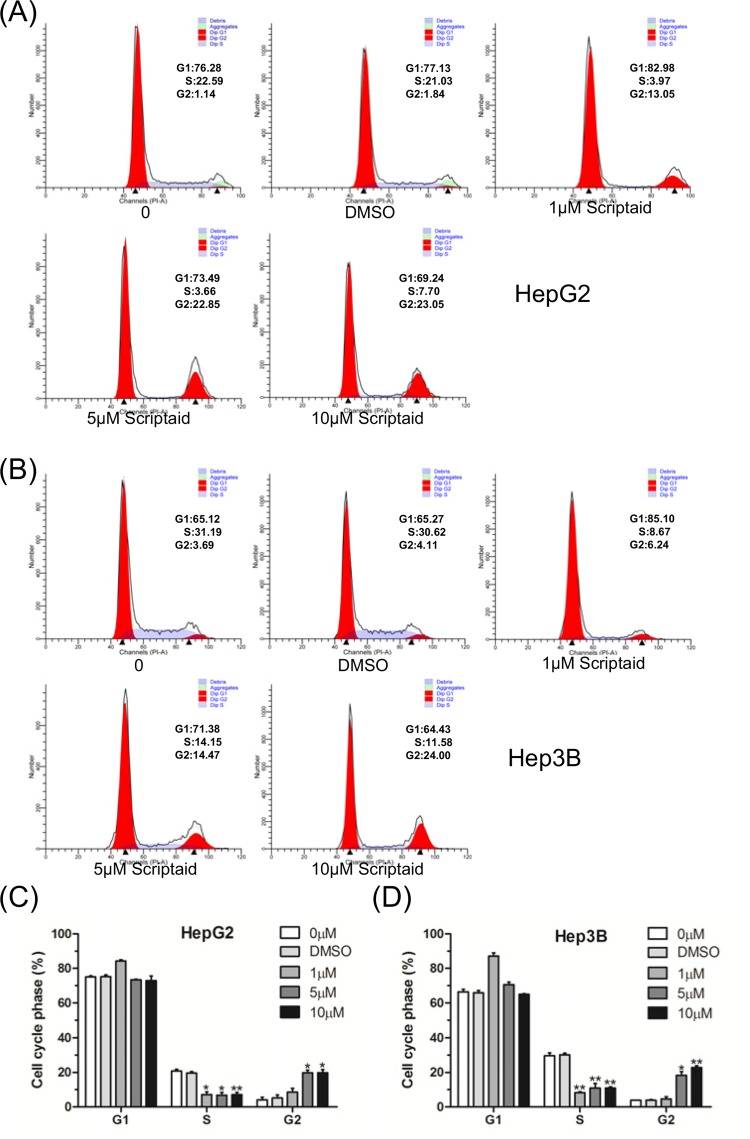
Figure 2. Scriptaid induced G2/M-phase arrest of HCC cells.
(A,B) HepG2 and Hep3B cells were treated with different concentrations of scriptaid for 24 h, and the cell cycle was detected by flow cytometry. (C,D) The distribution of the HepG2 and Hep3B cells’ subpopulations treated with scriptaid was analyzed based on three independent experiments. The experiments were conducted three times. Error bars: mean + S.D.; *, P<0.05; **, P<0.01.

