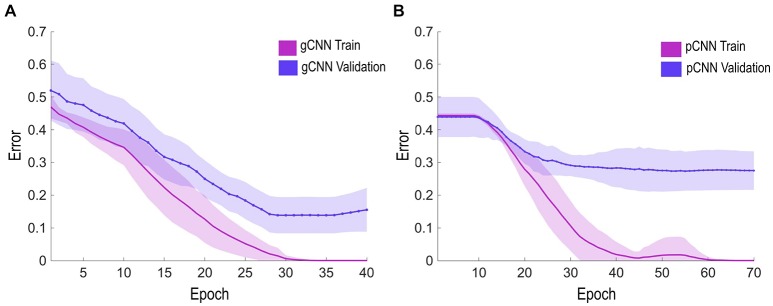
Figure 5.
Error rate learning curves during the training and validation epochs. The solid line represents the average error rate of 10 models (for 10-fold validation), and the shaded region represents standard deviation of the models at each epoch. (A,B) show the learning curves of the gCNN and pulse-coupled neural network (pCNN). The gCNN was trained earlier and had superior performance over the pCNN.

