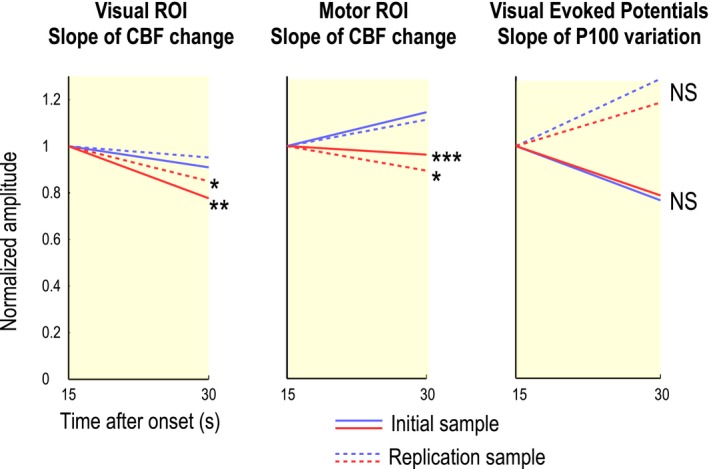
Figure 4.

Slope of functional hyperemia over the 15–30‐sec time frame in patients and controls. An analysis of the CBF response, performed by comparing the slopes between 15 sec and 30 sec (yellow segment in figure 3) after the stimulus onset using a simple single‐segment linear regression model, showed a significant difference between 19 patients and 19 controls in visual (P = 0.00723) and motor (P = 0.000907) ROIs. Similar results were obtained in an analysis of a replication sample of 10 patients and 10 additional healthy individuals. Conversely, results obtained using the same analysis of P100 amplitudes derived from EEG records in the visual cortex showed no significant difference between the two groups (P = 0.928). *P < 0.05; **P < 0.01; ***P < 0.001
