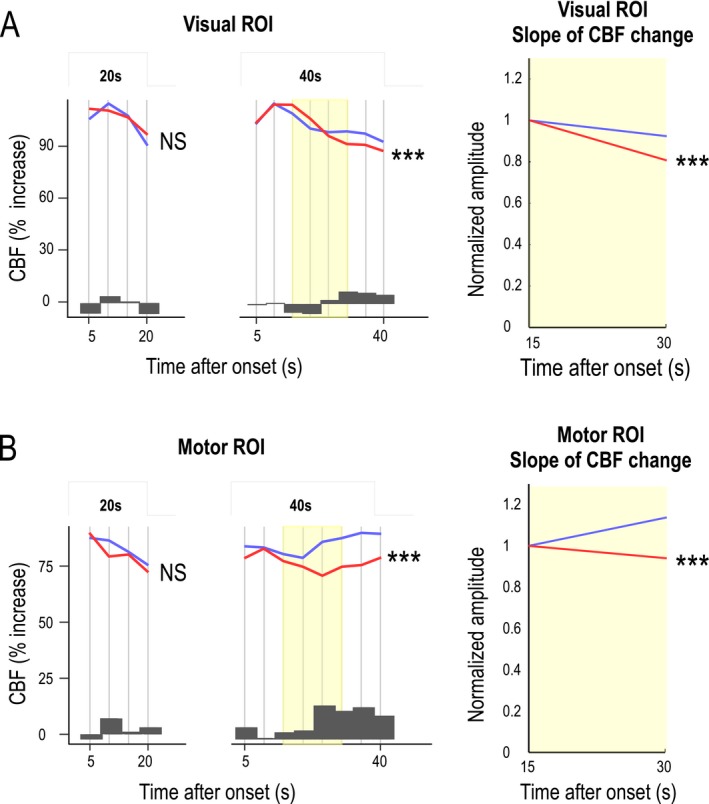
Figure 5.

Functional hyperemic responses in the entire population. (A and B) Functional hyperemia in the visual cortex (A) and sensorimotor cortex (B) during activation was fitted in the whole population (29 patients and 29 controls) as was previously done using the piecewise linear mixed‐effects model. Likelihood ratio tests showed a significant difference between the dynamics (slopes) of the response obtained in patients (red) and controls (blue) for long‐lasting stimulations (***P < 0.001). Changes in functional hyperemia dynamics appeared between 15 and 30 sec (yellow). Dark gray bars represent differences between mean CBF values measured at the different time intervals in control subjects and patients. The CBF response analyzed by comparing the slopes between 15 and 30 sec after the stimulus onset using a simple, single‐segment linear‐regression model confirmed the highly significant difference between the 29 patients and 29 controls.
