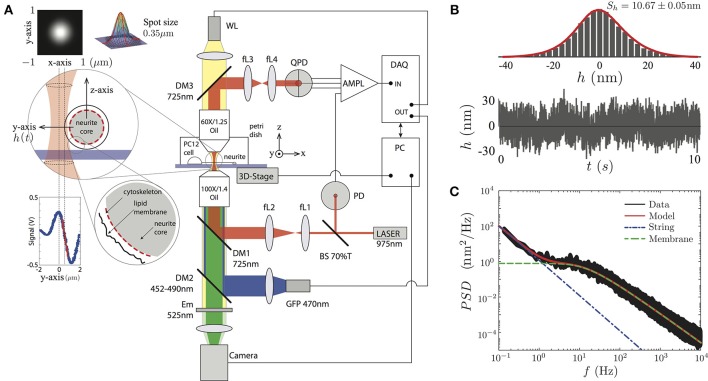
Figure 2.
(A) Sketch of the experimental setup. The PC12 neurites are imaged by a white lamp (WL) placed at the top of the setup or by the fluorescent lamp (LED) placed after the IR laser. The PC12 neurite edge is placed near the highly focused laser (less than 10mW). The light scattered by the neurite edge is imaged on a QPD sensor, amplified and recorded by the DAQ card. The conversion from voltages to displacements at the QPD sensor is performed using the slope of the signal in the linear region (red segment at the Signal vs. Position inset plot). The whole system is supported by a passive vibration-damping optical table. (B) The temporal transverse amplitude fluctuation, h(t), is acquired during 10 s, displays a Gaussian probability amplitude distribution of a particular PC12 neurite. (C) The PSD is obtained over four decades in the frequency space. The full model (red continuous line), the string (blue point-segmented line), and the membrane (green segmented line) models are shown to be in a complete agreement with the experimental data.

