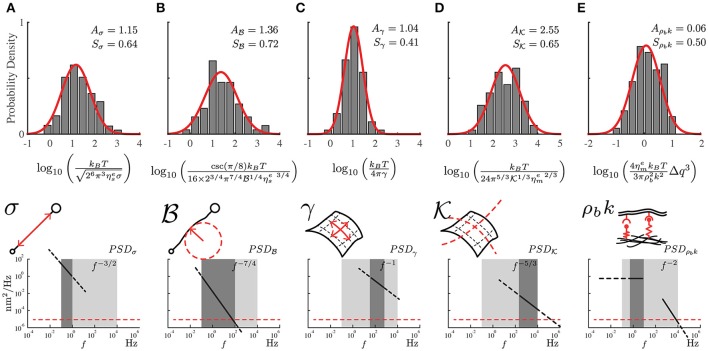
Figure 3.
The probability distribution of the mechanical properties for the PC12 cell neurites using the local power-laws and amplitudes for each frequency regime. (A) Axial tension σ, (B) Flexural rigidity . (C) Plasma membrane surface tension γ. (D) Plasma membrane bending and (E) Membrane to cytoskeleton coupling ρbk. The mechanical parameters are represented in the sketches including the approximate range of frequencies and the theoretical power-laws for each one of them (dark gray region). The light gray region represents the range of available frequencies while the red segmented line represents the low detection limit of the instrument. The samples were prepared weekly, we recorded four to six neurites per week reaching a total of 75 neurites (N = 75).

