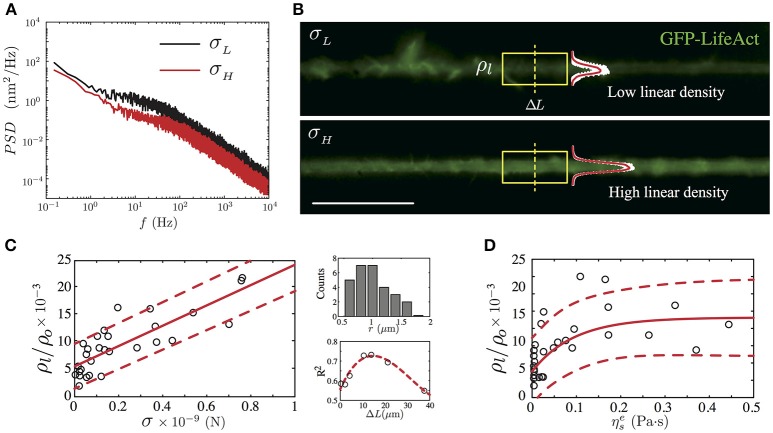
Figure 5.
GFP-LifeAct cytoskeleton imaging of PC12 neurite samples after 4 days of growth. (A) Power Spectrum Density of two PC12 neurites, where the black solid line represents a neurite whose mean fluctuation amplitude is of the order of 9.47 ± 0.15 nm and an axial tension value of 0.16 ± 0.01 nN, whereas the red solid line represents a neurite with a mean fluctuation amplitude value of 7.38 ± 0.16 nm and an axial tension value of 0.45 ± 0.04 nN. (B) Irregular F-actin distribution in a PC12 neurite with a low actin presence (top panel). Homogeneous F-actin distribution in a PC12 neurite with a high actin presence (bottom panel). The linear density is computed using the section framed in yellow. The mean intensity profile and its standard deviation are plotted to show the intensity variations in both cases. Scale bar 20μm. (C) The main panel shows the linear trend between the normalized linear F-actin density (ρl/ρo) and the neurite axial tension (the red solid line stand for the best linear fit). Whereas the secondary panels display the neurite radii distribution and the R-square correlation value as a function of the segment ΔL. (D) The dependency of the normalized linear F-actin density as a function of the neurite effective viscosity (the red solid line stand for the best exponential fit). The red segmented line represents the confidence bound with the 95% of the data in the main plots of (C,D). For the F-actin labeled version of the PC12, N = 28 neurites were imaged prior to the TFS measurement.

