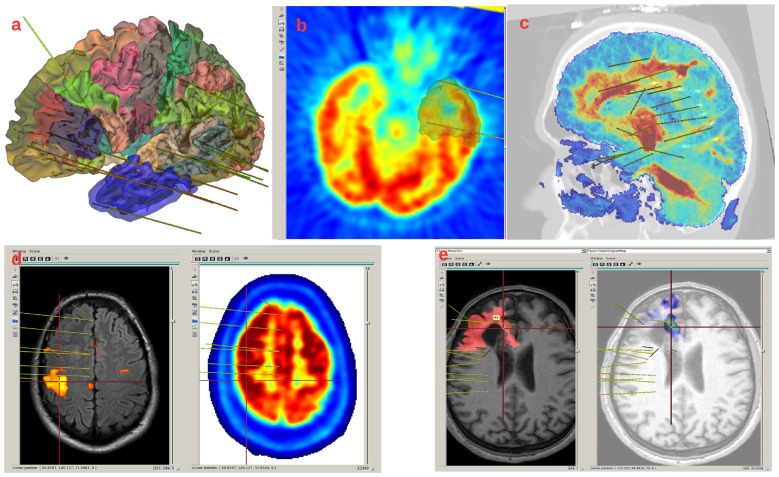
Figure 5.
Example of images displayed in LocateElectrodes interface. (A) MarsAtlas parcellation on the white matter mesh, with the mesh of the resection in transparent blue. (B) PET and resection mesh in gray. (C) Fusion of the T1MRI and the Diffusion Tensor Imaging (DTI) reconstruction (the colormap codes for the number of fibers, obtained from FSL software), (D) fMRI result on the left, PET on the right, (E) T1 and resection mask in red on the left, fusion of the T1 and the Epileptogenicity Index map on the right.

