Figure 7.
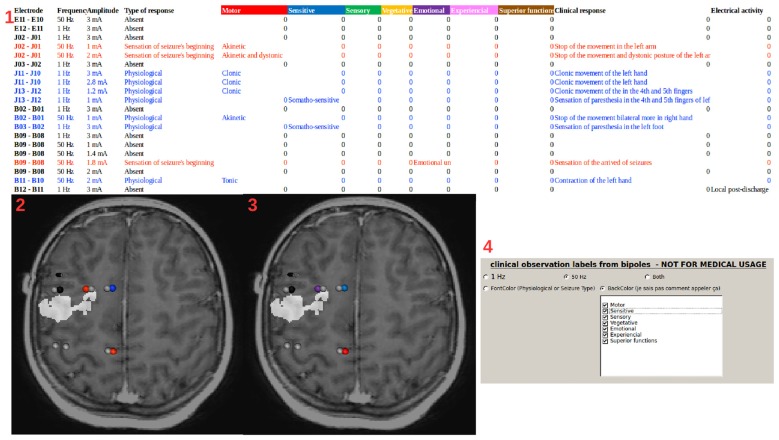
Stimulation labels. (1) Example of a table file (first line and column generated by IntrAnat) filled manually during the stimulation sessions. The file is then read by IntrAnat and integrated into the database. Information can be displayed by LocateElectrodes as in (2) and (3) using the pre-implantation T1 fused with the resection mask (in white) as a background. Using the GUI (4), one can select the information that is displayed (in the case of cortical stimulation here, 1 Hz stimulation, 50 Hz stimulation or both). The font color of the table file is used to set the colormap: non-stimulated contacts in gray, stimulated contacts with no clinical observation in black, stimulated contacts where the patient had a response but without a link to epilepsy in blue, stimulated contacts where the patient had a response similar to the beginning of a seizure in red (2). Alternatively, one can display the classification of the response (using the background color of the line 1 of the table file): motor in red, sensitive in blue, sensory in green, vegetative in yellow, emotional in purple, experiential in pink and superior function in brown (3). The GUI (4) allows to display all or part of these classifications. Contacts not recorded in the SEEG file are not represented.

