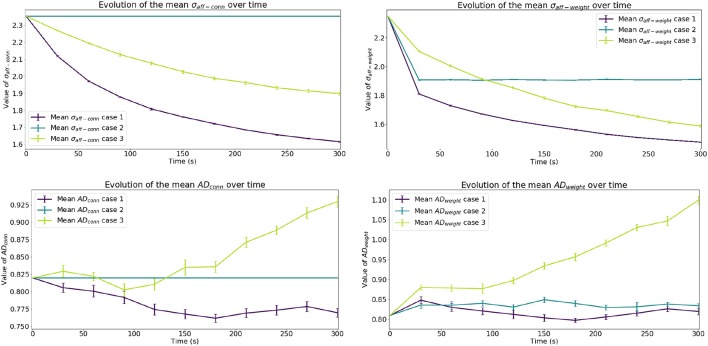
Figure 3.
Evolution of results of interest. The top row shows the evolution of the mean spread of receptive fields over time, considering both unitary weights (σaff−conn) and actual weights (σaff−weight) at that point in time. The bottom row shows the evolution of the mean Absolute Deviation of the receptive fields considering connectivity (ADconn) and weighted connectivity (ADweight). Error bars represent the standard error of the mean.

