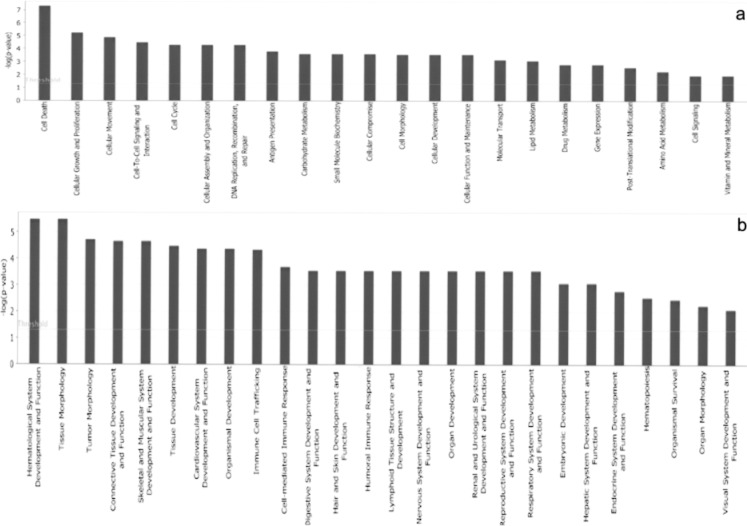
Figure 5.
Top biological functions. The functional analysis of the gene list allowed the identification of the biological functions that were most significant to the data set. Genes from the gene list were grouped into functional categories displayed along the x-axis; the y-axis displays the significance (−log p-value). The threshold line is set as default at p = 0.05. Distinct bar graphs are used to list the top Molecular and Cellular Functions (a) and the top Physiological System Development and Functions (b).

