Figure 6.
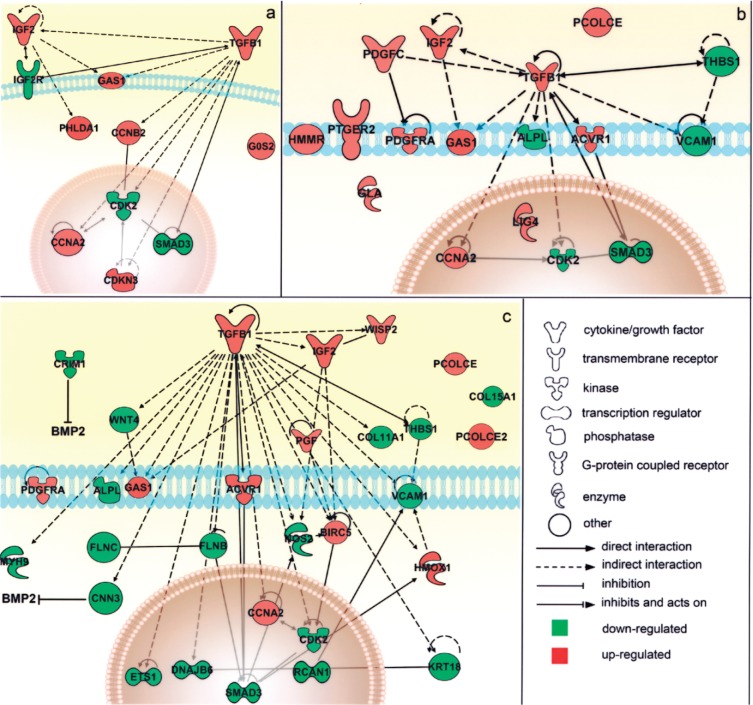
Schematic representation of the main modulated genes and their reciprocal interactions in the cell. Genes significantly associated to the main biological functions resulted from the functional analysis were associated in the graphical representation of their reciprocal interaction, represented as nodes, and the biological relationship between two nodes is represented as an edge (line). All edges are supported by at least 1 reference from the literature, from a textbook, or from canonical information stored in the Ingenuity Pathways Knowledge Base (www.ingenuity.com). The node color indicates the direction of gene modulations: upregulation (red) or downregulation (green). Nodes are displayed using various shapes that represent the functional class of the gene product. Separate graphs show distinct functional categories significantly associated to the gene list. (a) Cell death/cell growth and proliferation: the transcriptional modulation of the genes in this group pointed toward cell cycle arrest and the inhibition of cell proliferation, which usually precede cell differentiation. (b) Connective tissue development and function, mainly involving genes that interact reciprocally within the TGF-β1 signaling pathway. (c) Muscular and skeletal tissue development and function, which includes genes that interact either directly (such as the ACVR1 receptor on the cell membrance and the SMAD3 regulator in the nucleus) or indirectly (such as IGF2) with the TGF-β1 pathway and genes involved in extracellular matrix deposition (including PCOLCE, PCOLCE2, and the collagen isoforms COL11A1 and COL15A1), suggesting the initial osteoblastic commitment of cells (see text for additional details).

