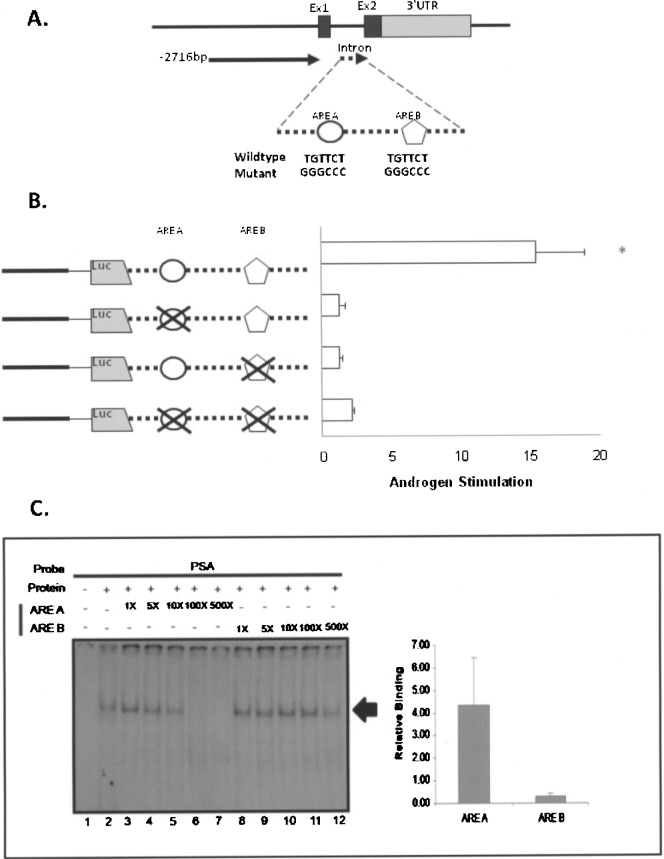
Figure 4.
Relative affinity of androgen receptor binding to Nkx3.1 ARE A and ARE B. (A) A diagram of Nkx3.1 intron with two potential AREs (ARE A and ARE B) is shown. The WT and mutated sequences for each ARE (ARE A and ARE B) are shown. Mutations were constructed in the Nkx3.1-2716 + intron vector shown in Figure 2. (B) Androgen Stimulation of Nkx3.1-2716 + intron, ARE A mutant, ARE B mutant, and double mutant was tested in LNCaP cells. The results shown are calculated as the fold induction of each construct in cells treated with R1881 relative to cells treated with vehicle (ethanol) alone. Data are generated from three experiments performed in quadruplet for each condition and were plotted as the mean ± SEM and the asterisk indicates significantly different from other mutant constructs (p > 0.05). (C) Radiolabeled PSA ARE was incubated with lysate derived from the Tramp C-1 cell line and tested for relative binding affinity by competition experiments. The experiment included the PSA ARE probe incubated with no protein lysate (lane 1), or with protein lysate alone (lane 2), and with protein lysate containing 1-fold, 5-fold, 10-fold, 100-fold, and 500-fold molar excess of unlabeled ARE A (lanes 3–7) or ARE B (lanes 8–12). The resultant bands were visualized on a Fuji 5100 phosphoimager and the amount of radioactivity associated with each band was quantified by scanning densitometry. For graphical analysis, the band intensity of each lane was quantified, the values plotted versus the molar excess of added unlabeled probe, and the slope of the resultant line was calculated for ARE A and ARE B, respectively, and plotted as relative binding. The values obtained for three separate experiments were averaged and plotted ±SEM.

