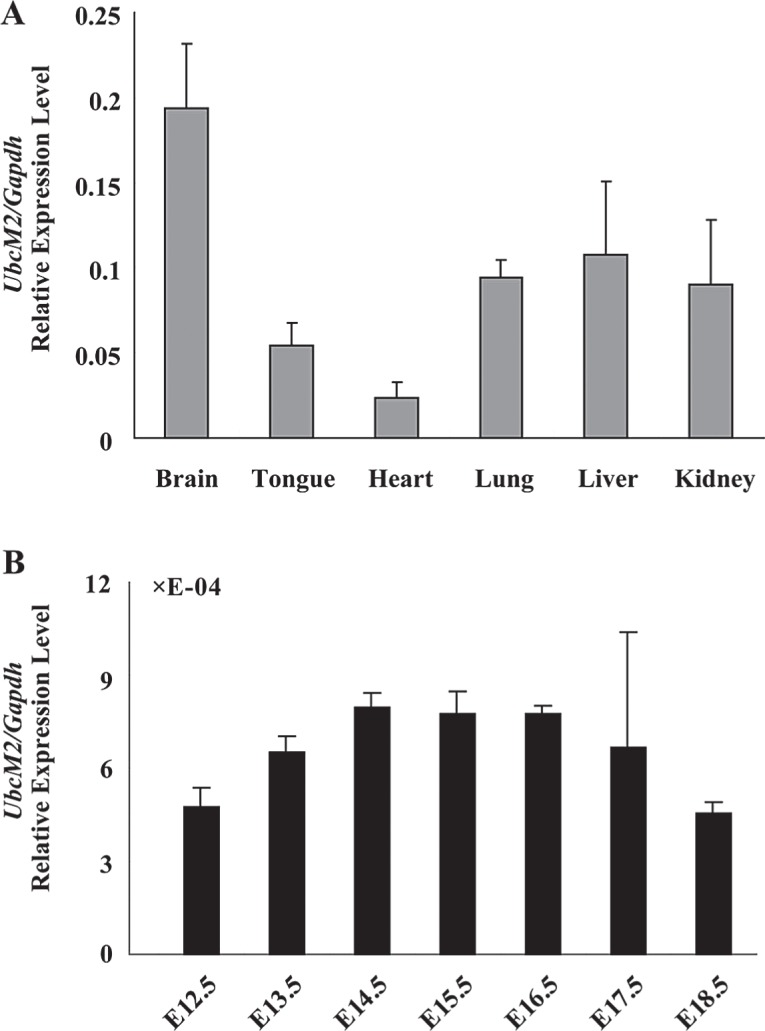
Figure 4.

The qRT-PCR analysis of UbcM2 in E15.5 and in developing brain. (A) The expression of UbcM2 in different tissues of E15.5. (B) The expression profiles of UbcM2 in developing brain from E12.5 to E18.5. Data were expressed relative to the corresponding values for Gapdh. Error bars represented the standard deviation in three independent experiments.
