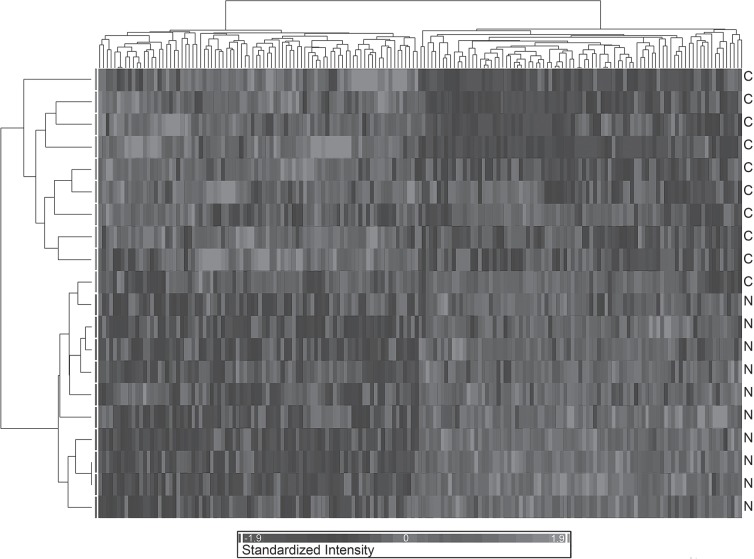
Figure 1.
The hierarchical dendrogram represents the “condition tree” where the subjects are in row and the genes in column (gray scale of expression on the bottom side). The individual expression signal of the statistically significantly modulated transcripts across the categories (i.e., C: CTRL, N: NRLCP) was clustered: the transcripts with most similar expression blueprints across the different subjects were placed adjacent to each other. The clustering algorithm allowed the identification of two main trends in gene expression, discriminating the control from the narcoleptic individuals.

