-
A
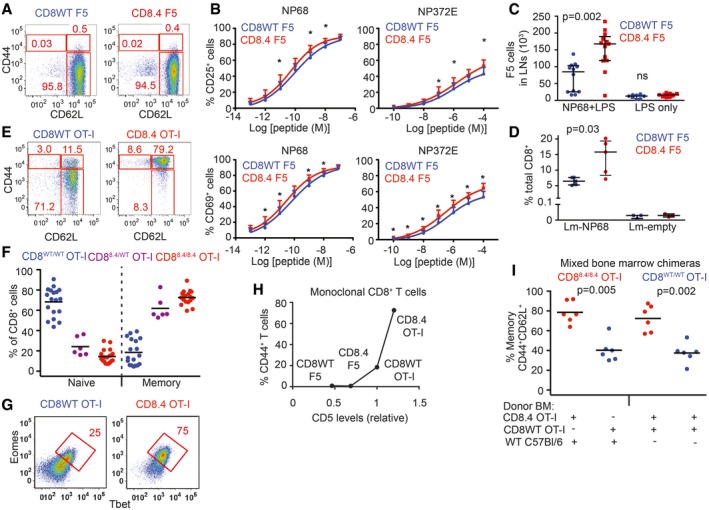
LN cells isolated from CD8WT F5 and CD8.4 F5 mice were analyzed by flow cytometry (gated as viable CD8+CD4−). A representative experiment out of 4 in total.
-
B
LN cells isolated from CD8WT F5 and CD8.4 F5 mice were stimulated with antigen‐loaded DCs overnight and CD69 or CD25 expression was analyzed by flow cytometry. Mean + SEM. n = 7 independent experiments. *P < 0.05.
-
C
2 × 10⁶ CD8WT F5 or CD8.4 F5 LN T cells were adoptively transferred into Ly5.1 WT host 1 day prior to immunization with NP68 peptide and LPS or LPS only. Three days after the immunization, donor Ly5.2+ Ly5.1− CD8+ T cells from LN of the host mice were analyzed by flow cytometry and counted. Median ± interquartile range. n = 8–13 mice from seven independent experiments.
-
D
1 × 10⁵ CD8WT F5 or CD8.4 F5 LN T cells were adoptively transferred into Ly5.1 WT hosts and immunized with WT Lm (empty) or Lm‐NP68. Six days after the immunization, the percentage of donor Ly5.2+ Ly5.1− CD8+ T cells among all CD8+ T cells was determined. Median ± interquartile range. n = 3–5 mice from three independent experiments.
-
E, F
LN cells isolated from CD8WT OT‐I, CD8.4 OT‐I, and heterozygous CD8WT/8.4 mice were analyzed by flow cytometry (gated as viable CD8+ CD4−). Percentages of naïve (CD44− CD62L+) and memory (CD44− CD62L+) CD8+ T cells were determined. n = 6–18 mice per group from at least five independent experiments.
-
G
Expression of Eomes and Tbet in CD8+ LN T cells isolated from CD8WT OT‐I and CD8.4 OT‐I mice was determined by flow cytometry. A representative experiment out of 3 in total.
-
H
Relationship between relative CD5 levels (CD5 on CD8WT OT‐I was arbitrarily set as 1) percentage of VM T cells (CD44+ CD62L+) using the data from indicated TCR transgenic strains. Mean value of n = 5–8 mice per group from at least five independent experiments.
-
I
Irradiated Rag2−/− host mice were transplanted with B‐cell and T‐cell depleted bone marrow from Ly5.1 C57Bl/6 together with CD8.4 OT‐I or CD8WT OT‐I bone marrow in 1:1 ratio (first two datasets) or, with bone marrow from CD8.4 OT‐I and CD8WT OT‐I mice in 1:1 ratio (last two datasets). Eight weeks later, LN cells were isolated and analyzed by flow cytometry. n = 6 mice per group from three independent experiments.
Data information: Statistical significance was determined using two‐tailed Wilcoxon signed‐rank test (B) and Mann–Whitney test (C, D, I).

