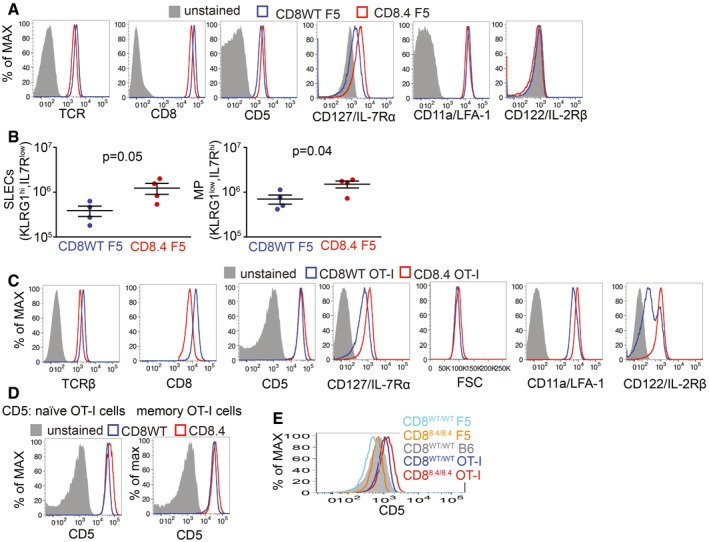
Figure EV1. Analysis of CD8WT and CD8.4 monoclonal T cells, related to Fig 1 .

- Expression of indicated surface markers on CD8WT F5 and CD8.4 F5 LN T cell was analyzed by flow cytometry. A representative experiment out of four in total.
- CD8WT F5 and CD8.4 F5 T cells primed by Lm‐NP68 (Fig 1D) were examined by flow cytometry. Absolute numbers of KLRG1+ IL‐7R− short‐lived effector cells and KLRG1− IL‐7R+ memory precursors were determined. Mean ± SEM. n = 4 mice per group from two independent experiments. Statistical significance was determined by two‐tailed t‐test. The data do not seem to be strongly deviated from the normal distribution and seem to have equal variance. However, because of the low n, we could not test the normality/equal variance rigorously.
- Expression of indicated markers on CD8WT OT‐I and CD8.4 OT‐I LN T cell and their size estimated by FSC signal was analyzed by flow cytometry. A representative experiment out of 10 in total.
- Expression of CD5 on CD44− (naïve) and CD44+ (memory subsets) of CD8WT OT‐I and CD8.4 OT‐I LN T cells was analyzed by flow cytometry. A representative experiment out of three in total.
- Expression of CD5 on T cells isolated from LN of indicated mouse strains by flow cytometry. A representative experiment out of two in total.
