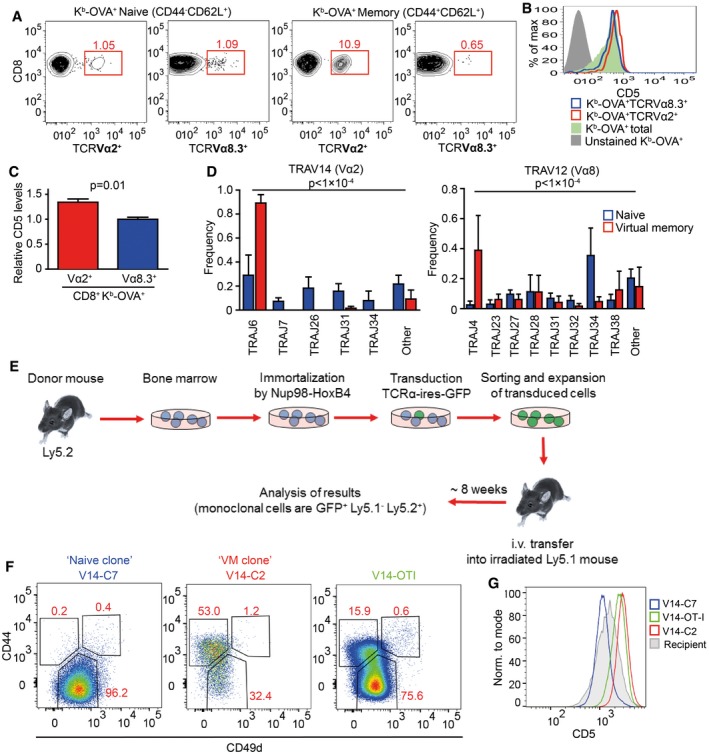
Figure EV3. Differences in TCR repertoires between naïve and VM T cells, related to Fig 3 .

-
AAlternative gating strategy for the same samples as shown in Fig 3B–D (T cells from Vβ5 mice). A representative experiment out of eight in total.
-
B, CThe expression of CD5 on CD8+ Kb‐OVA‐4mer+ CD8+ Vα2+ or Vα8.3+ cells or total CD8+ Kb‐OVA‐4mer+ isolated from LN and the spleen was determined by flow cytometry. Relative MFI CD5 levels were quantified (CD5 levels on CD8+ Kb‐OVA‐4mer+ Vα8.3+ were arbitrarily set as 1). Mean + SD, n = 3 independent experiments. Statistical significance was determined using two‐tailed one‐value t‐test.
-
DTCRα sequences from Fig 3F were analyzed for TRAJ usage. Means + SEM. n = 4 independent experiments. Statistical significance was determined by chi‐square test.
-
ESchematic representation of the generation and analysis of retrogenic monoclonal T‐cell subsets.
-
FFrequency of VM T cells among monoclonal populations expressing TCR clones V14‐C2, V14‐C7, and OT‐I generated as in Fig 3G.
-
GCD5 levels on naïve monoclonal T cells expressing V14‐C2, V14‐C7, and OT‐I. Representative mice out of 9–14 in total from two to four independent experiments.
